Automotive Connected Vehicle
(IoT)
0 to 1: MVP for IoT Traffic Operations
Role
Senior Product Designer
Client & Market
Panasonic; B2B/B2G SaaS for Intelligent Transportation
Systems
Duration
~7 months from conception to launch
Impact Summary
Launched MVP in 7 months, kickstarting product and
team growth phase
Problem
United States roadways are becoming increasingly more congested and dangerous. As more cars hit the road and travel times increase, the risk of accidents rises and the traffic problem worsens.
Objective
To take the project from '0-1' by designing an MVP that uses connected vehicle data for real-time insights, aimed at reducing congestion and enhancing public safety in a new B2G market.
Team role
Led the V2X data ecosystem design as the Senior Product Designer within a startup team of 8-12, comprising engineers and transportation experts.
Users
Targeting State Departments of Transportation (DOTs), specifically their traffic operators.
Outcome
Successfully demoed to major state transportation department in seven months, kickstarting significant team and product growth within the Panasonic business unit.
I.
Tackling Transportation Challenges with V2X Technology
United States roadways are increasingly congested and dangerous. In 2018, 38,000 lives were lost to traffic accidents, and drivers wasted 97 hours yearly in congestion, costing individuals roughly $1,350 each.
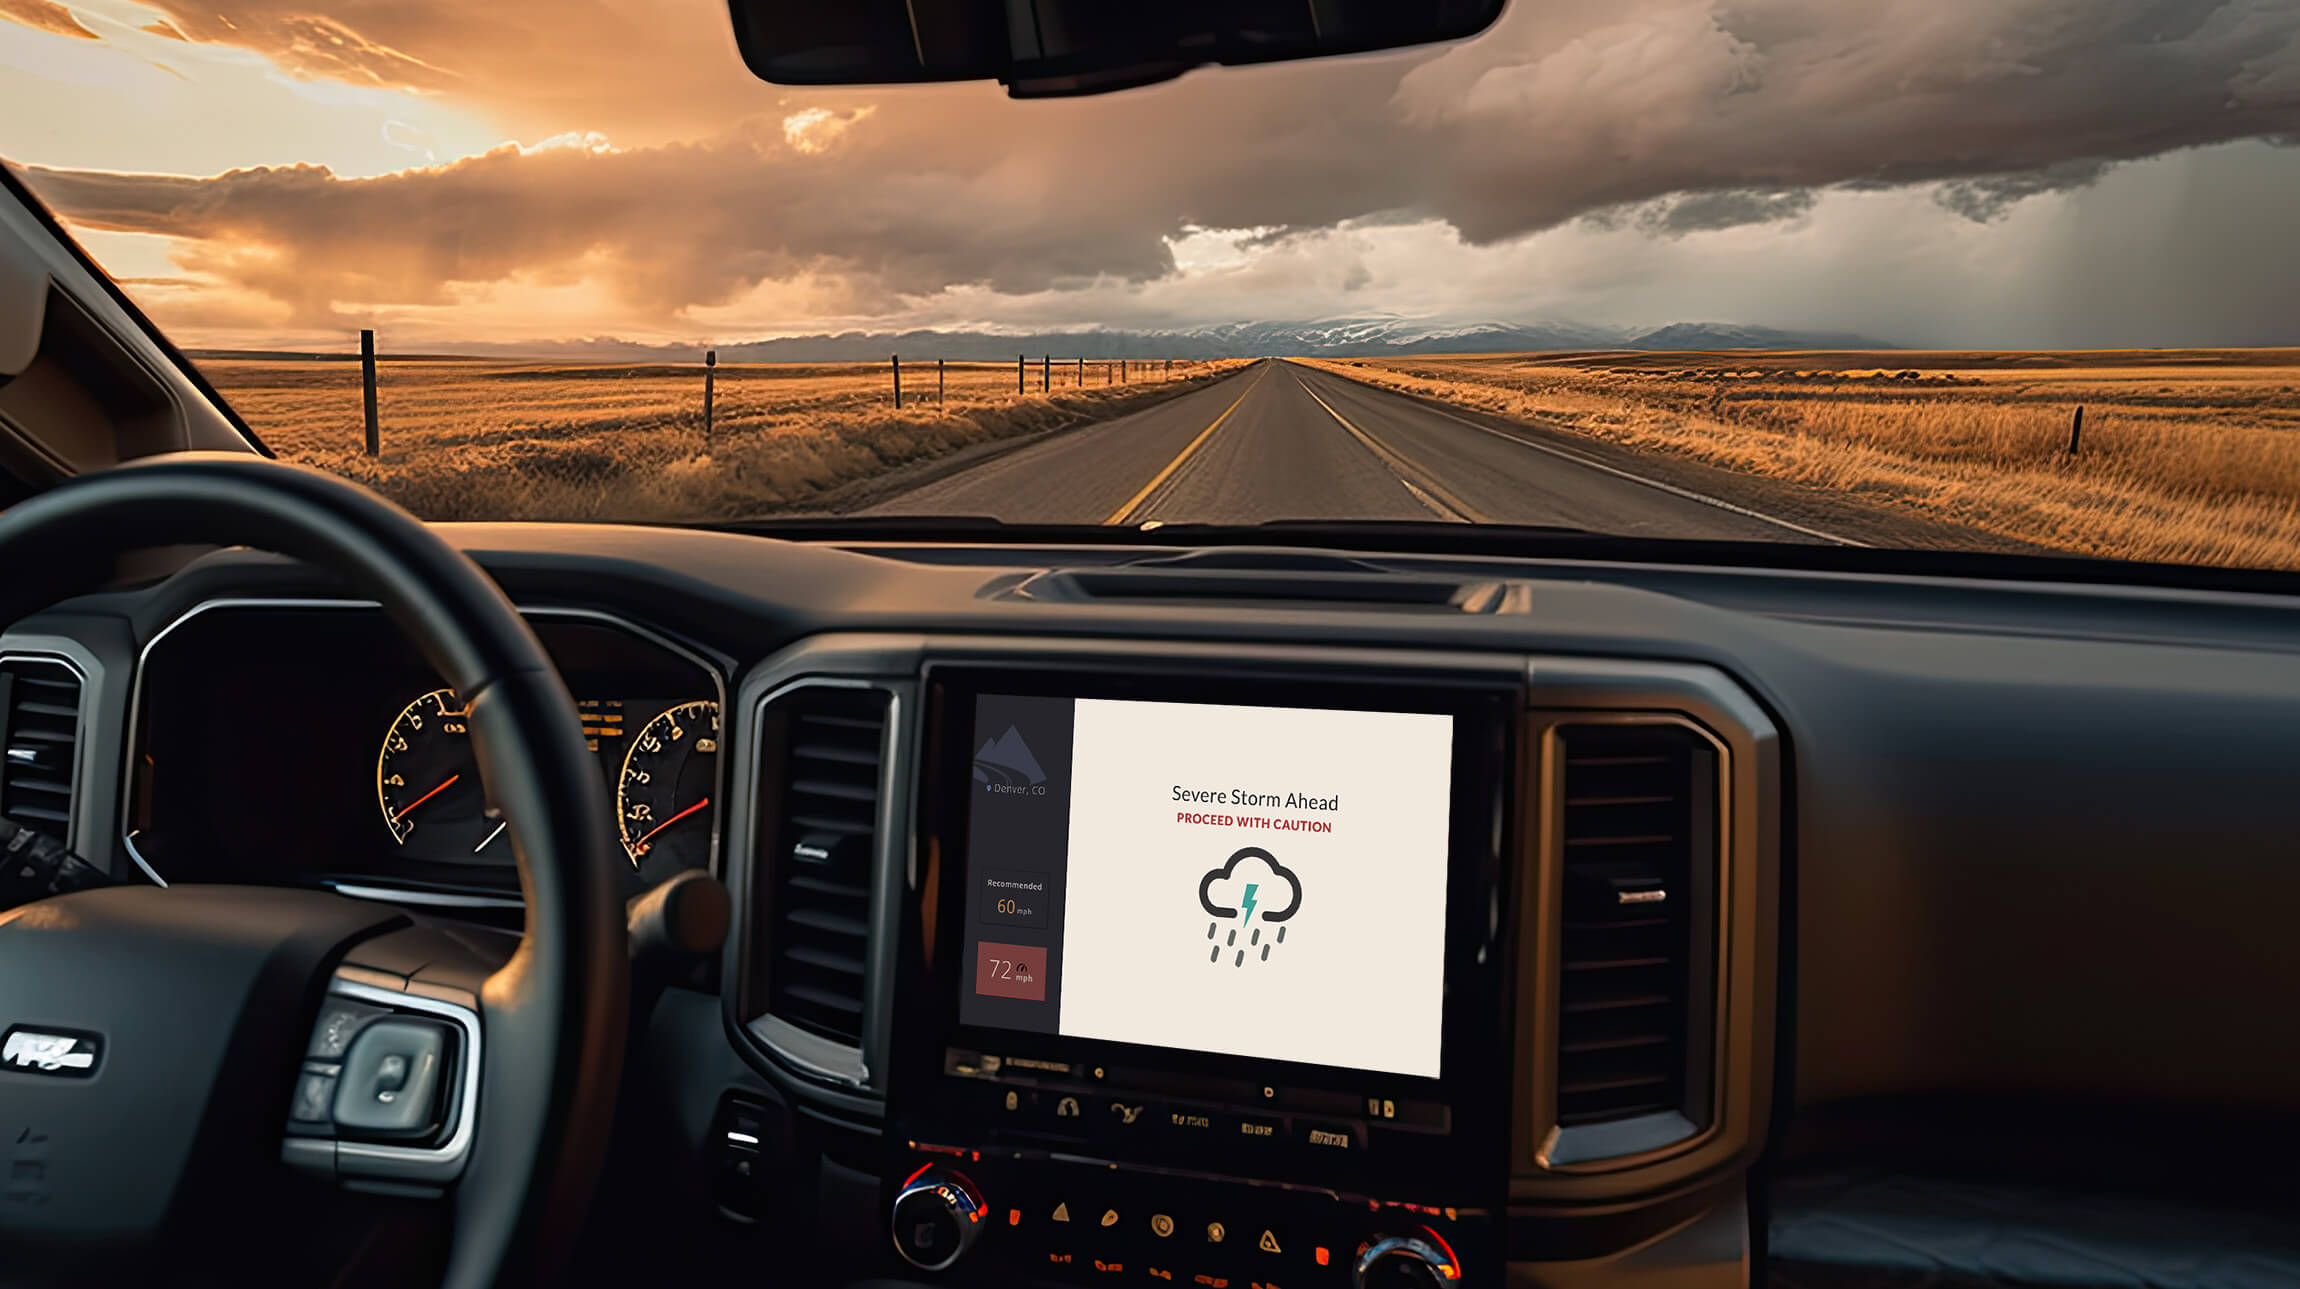
V2X technology transforms vehicle data into insights
V2X technology enables vehicles to communicate with infrastructure, other vehicles, and traffic management systems, providing real-time data crucial for enhancing roadway safety and efficiency. This could be scenarios such as:
- Providing real-time snapshots of road conditions
- Identifying imminent congestion through hard braking
- Detecting icy roads via environmental sensors
State Departments of Transportation (DOTs) can use this V2X data to monitor traffic conditions and respond to incidents significantly faster, leading to improved traffic flow, enhanced safety, and reduced travel time for drivers.
My Role
My role was to take the project from '0-1' by designing an MVP that uses connected vehicle data for real-time insights, aimed at reducing congestion and enhancing public safety in a new B2G market.
Goal: Design an MVP using connected vehicle data for real-time insights to reduce congestion and enhance public safety in a new B2G (Business-to-Government) market.
II.
Identifying user challenges and initial assumptions
At the start of the project, we didn't have in-depth access to DOT insights, but we did have some initial assumptions to guide us. We leveraged the expertise of our team, drawing on their industry experience to build a foundational understanding that was crucial for our early R&D stages. This internal knowledge helped shape our approach to building a viable MVP.
Traffic operators struggle with understanding roadway conditions quickly
Traffic operators monitor and manage traffic flow, ensuring roadway safety. They need real-time data for quick decision-making and efficient tools to respond promptly to incidents. Based on our initial knowledge and assumptions, their main pain points include:
- Slow response to incidents: Difficulty in taking quick action.
- Limited real-time information: Challenges in accessing current road condition data.
- Data reliability issues: Difficulty in verifying the accuracy of road conditions.
- Untimely communication to the public: Delays in providing timely updates to drivers.

Operator challenges directly impact drivers
Challenges faced by traffic operators lead to delays in addressing slick roads, congestion, accidents, and road hazards, directly affecting drivers and causing:
- Increased congestion and driver frustration
- Higher accident risks
- Longer travel times
III.
Harnessing V2X Data for real-time insights
Cars today are more than just vehicles; they're data hubs on wheels, equipped with sensors and connectivity for V2X technology. This technology transforms vehicle data into precise, meaningful roadway insights. Basic Safety Messages (BSMs), when combined with other data types, provide real-time snapshots of road conditions, such as imminent congestion indicated by frequent hard braking, or icy roads detected through environmental sensors and driver actions.
Challenge: Understanding a complex system
One of the biggest challenges was designing within the unstructured landscape of V2X (Vehicle-to-Everything) technology, where standards and user expectations didn’t yet exist. I needed to:
- Identify meaningful, actionable data from a stream of real-time V2X signals
- Map the full data flow from vehicles to cloud systems
- Collaborate with engineers to ensure accuracy and interpretability
- Help define how operators would understand and act on this new class of data
IV.
Early concepts reveal incomplete understanding
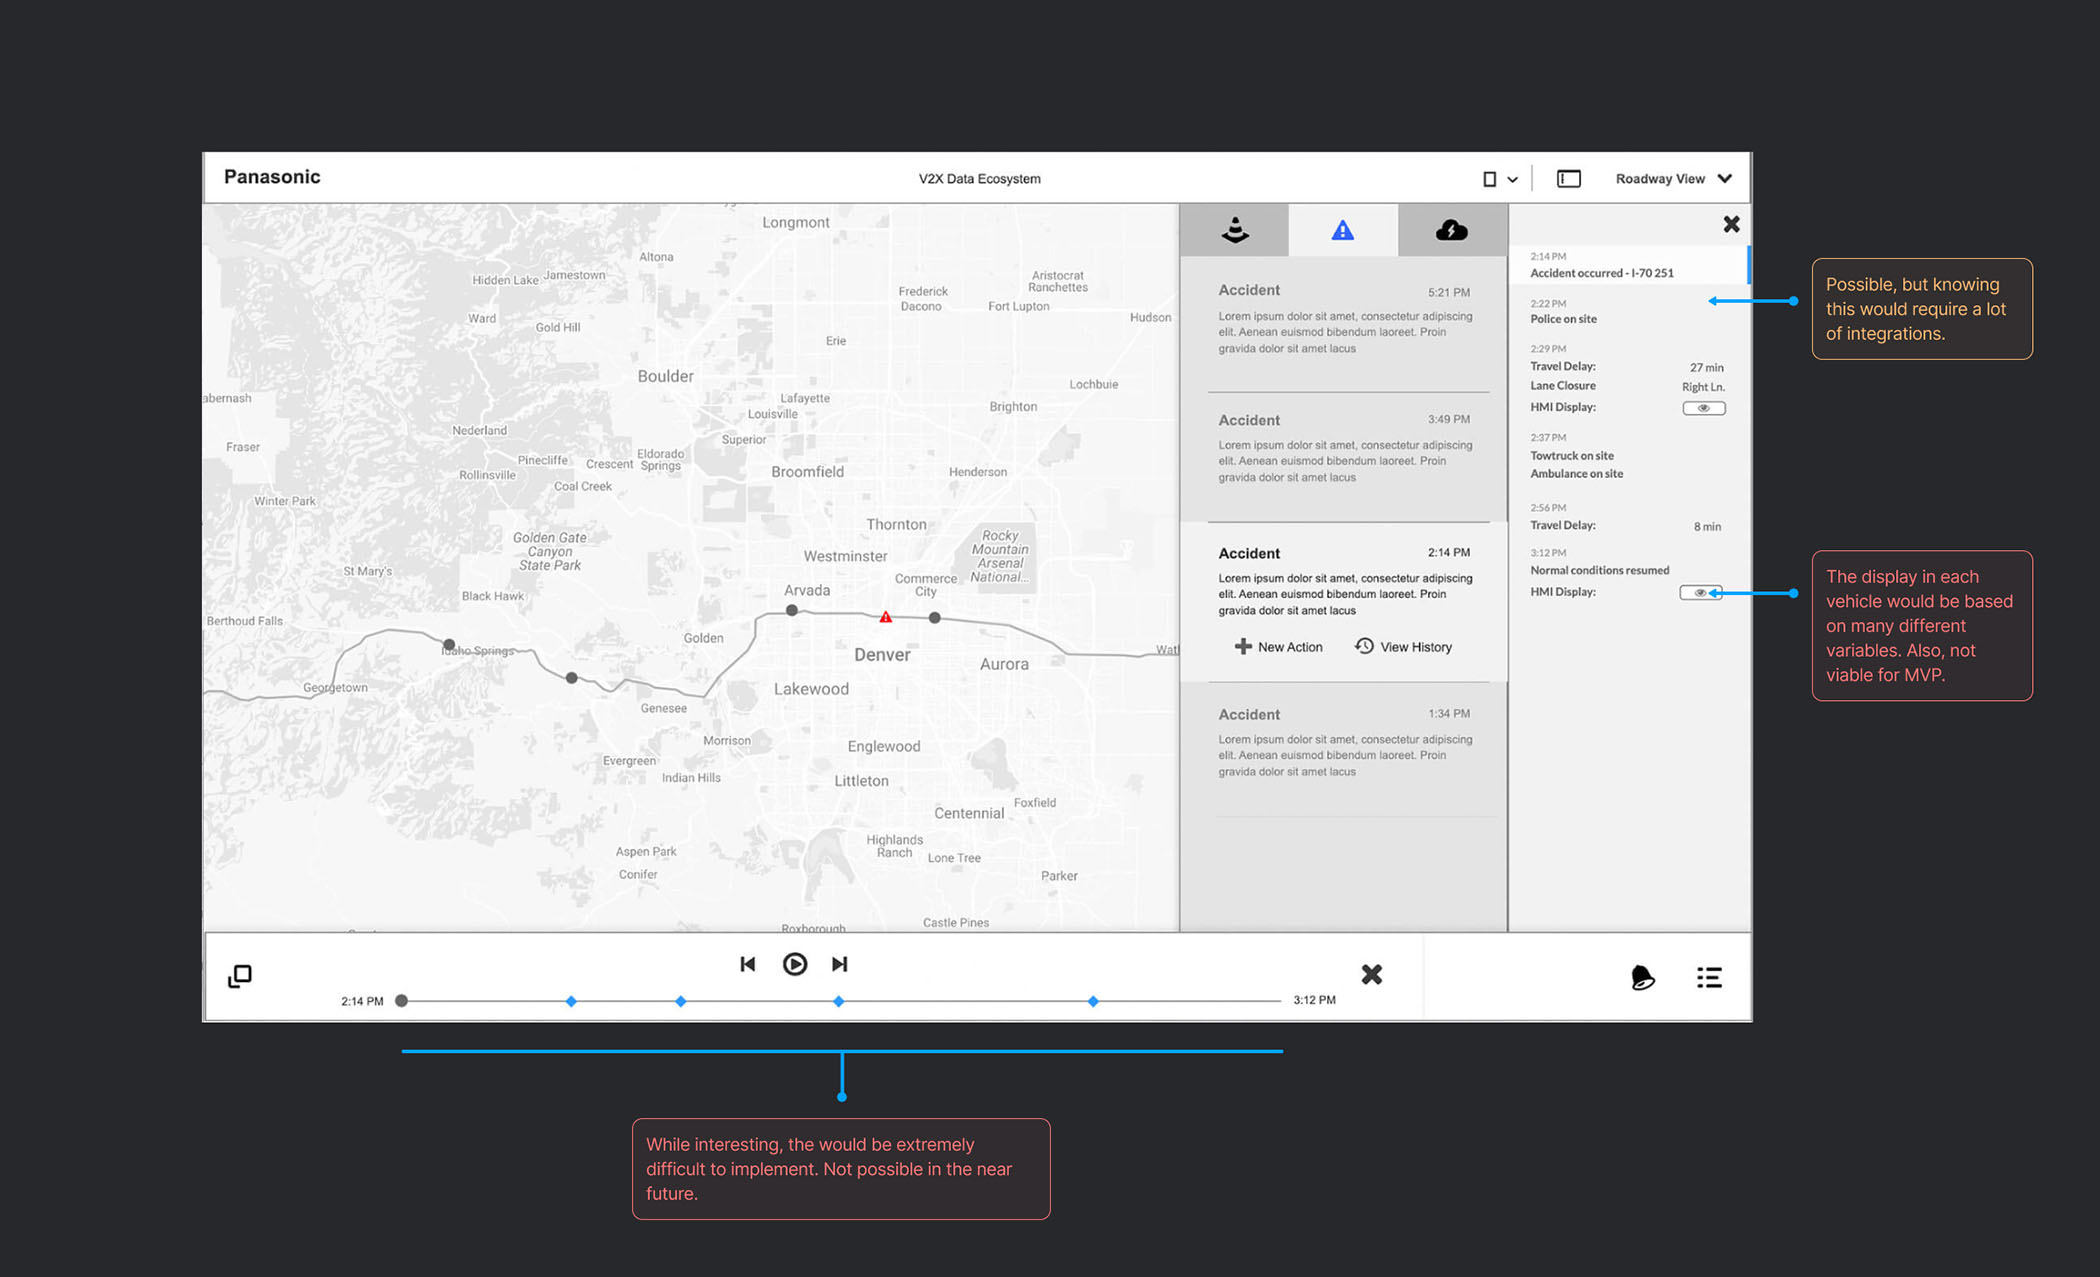
I extensively reviewed all documentation on V2X technology, understanding how it worked, the types of hardware involved, and the purpose each component served. I spoke with team members and observed operations in our lab with V2X-enabled fleet vehicles. This initially informed my creation of initial wireframes and concepts which I shared with the team.
 What data can the V2X roadside
units (RSUs) themselves tell us?
What data can the V2X roadside
units (RSUs) themselves tell us?
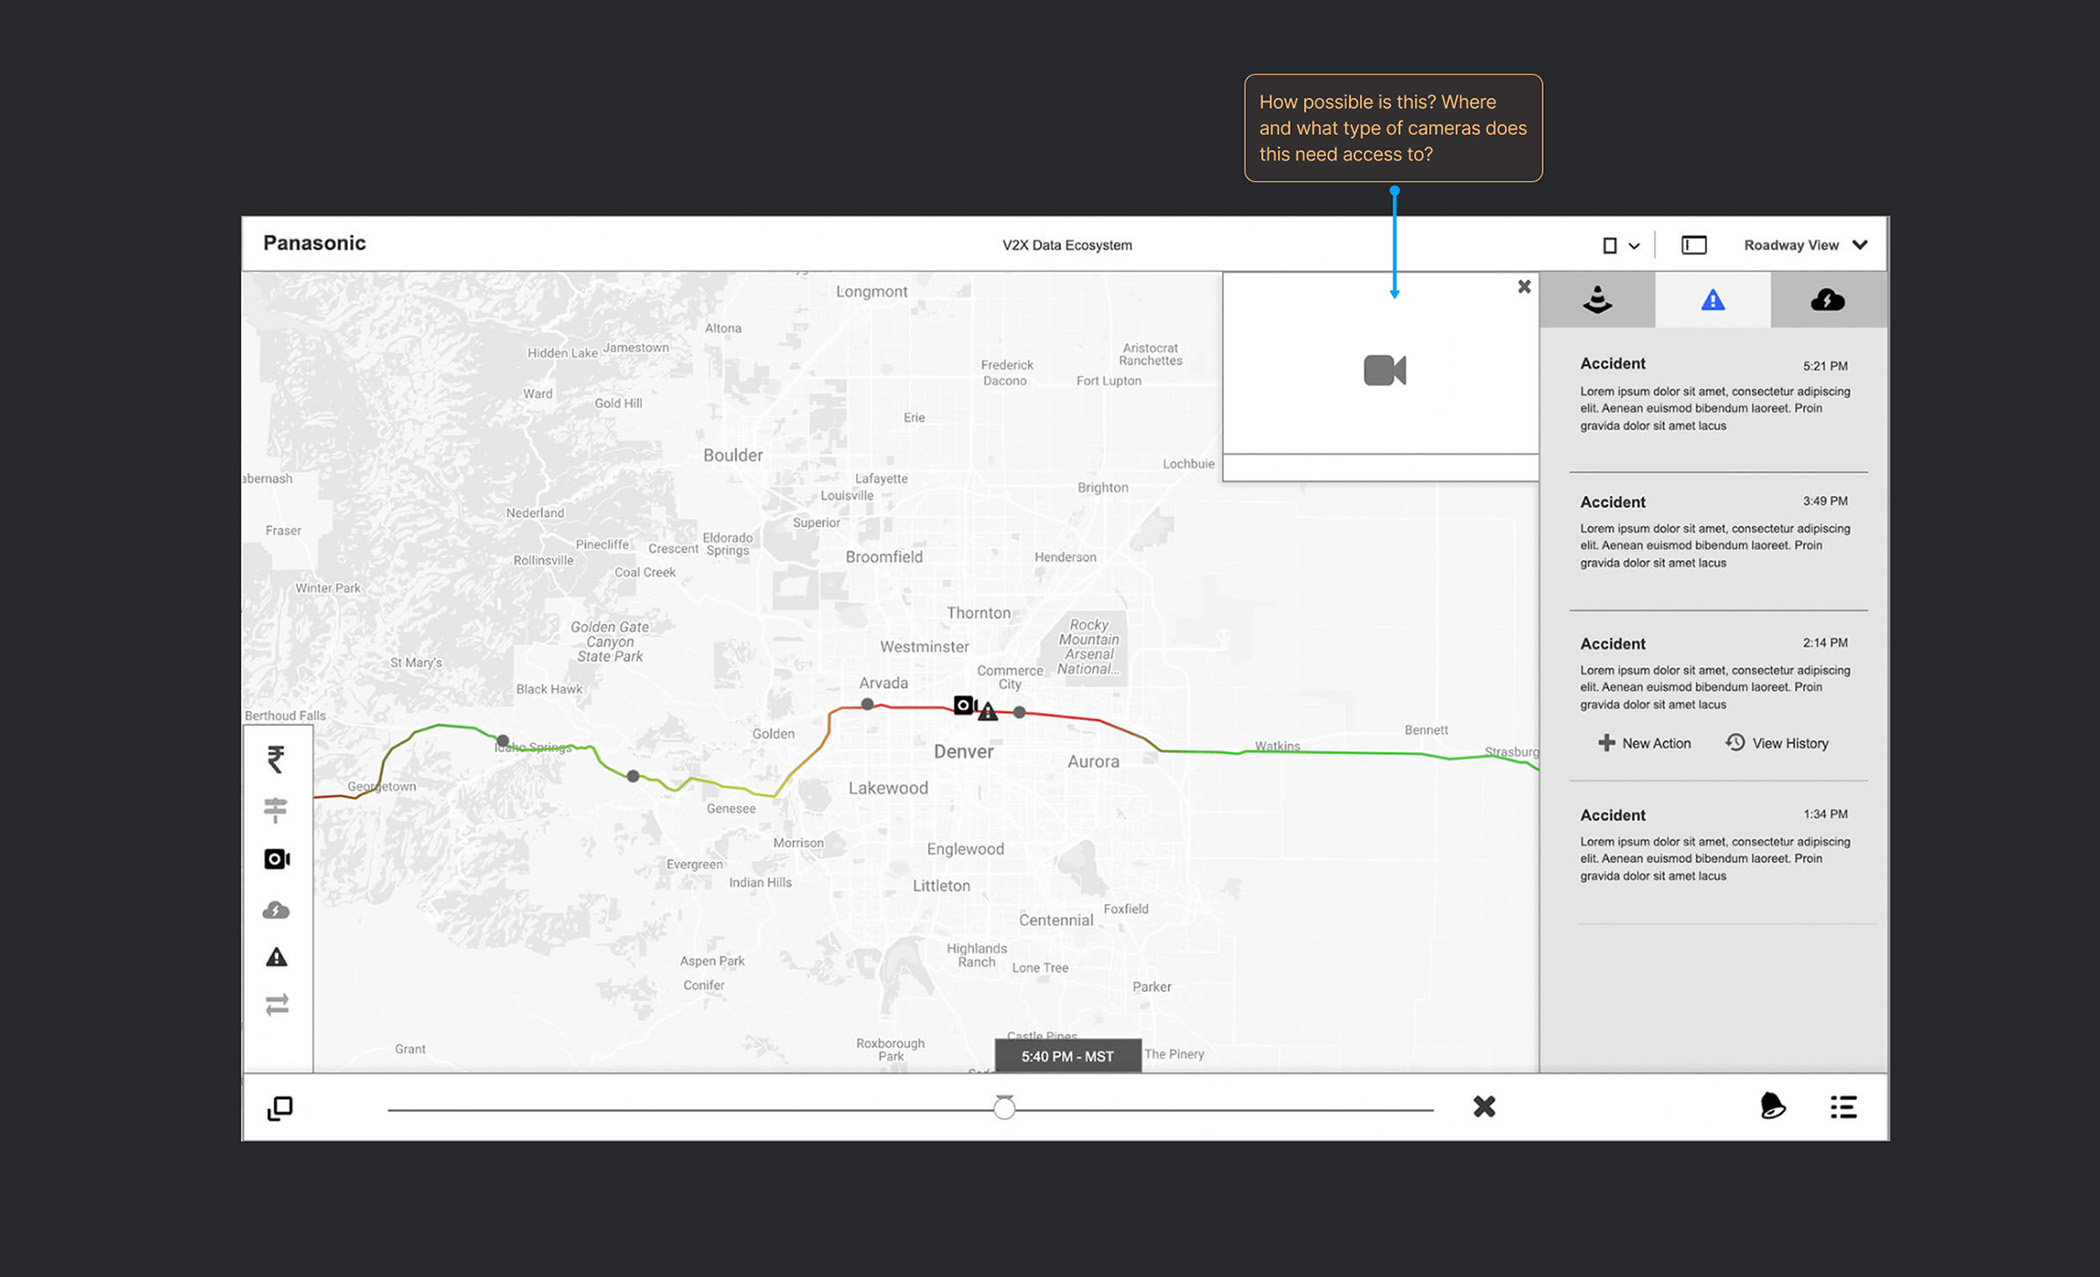
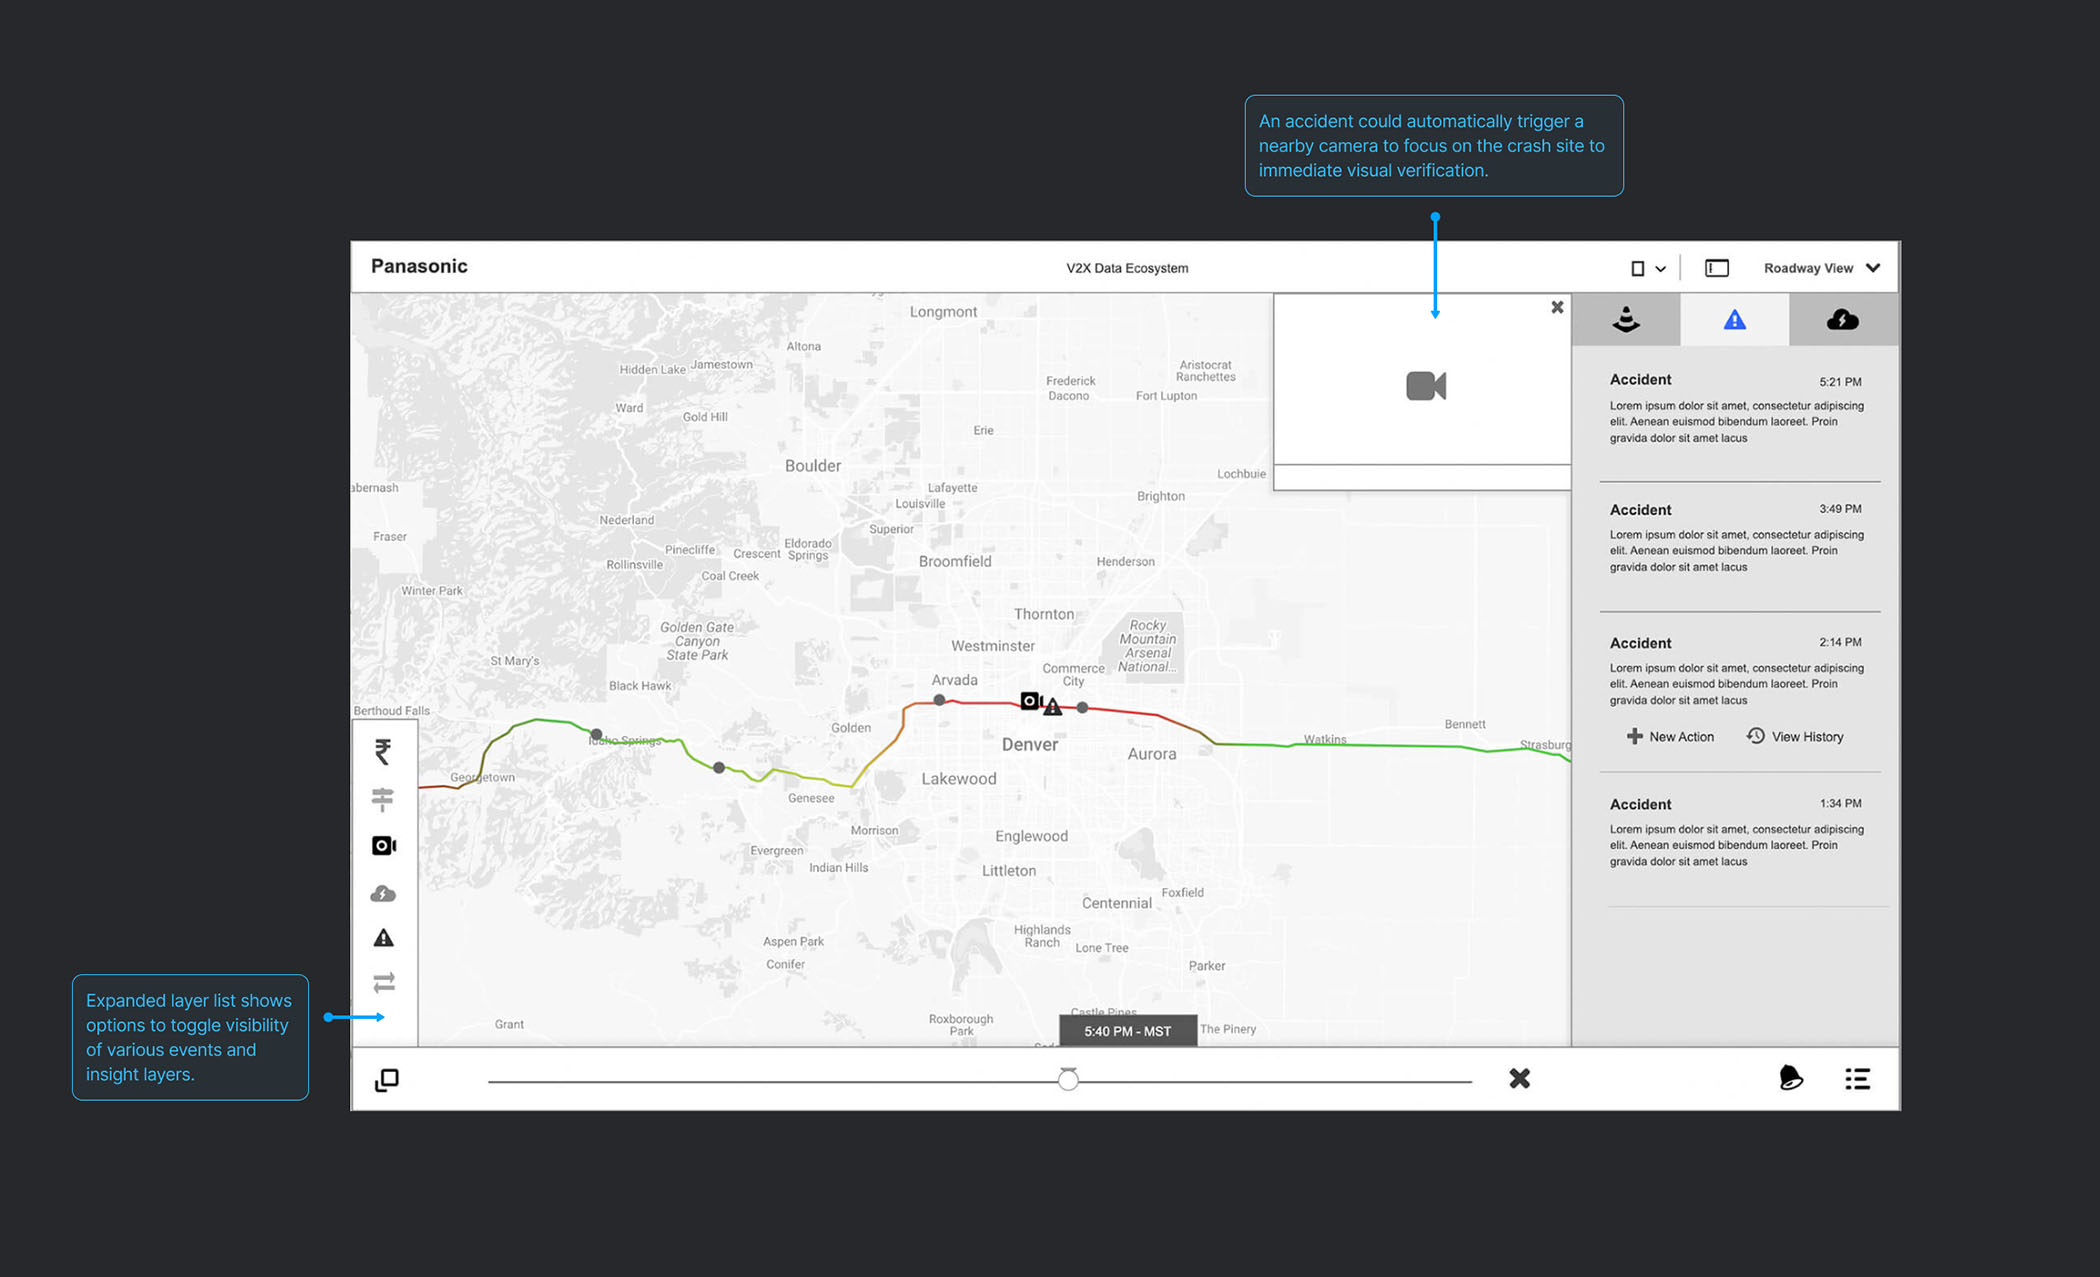 What if accident detection
triggers the nearest camera feeds?
What if accident detection
triggers the nearest camera feeds?
 What kind of timeline could an
accident show? What if we could see how V2X data changed over time?
What kind of timeline could an
accident show? What if we could see how V2X data changed over time?
Team feedback highlighted technical limitations
However, feedback from the team brought to light several technical limitations, which meant I had to dive deeper into understanding the data and collaborate more closely with our engineers. This feedback was essential in refining my approach, focusing on what was achievable, and making sure we had accurate and reliable data to work with.

Revisiting BSM data for deeper understanding
Following the feedback, I engaged in extensive collaboration with various engineers, including hardware, embedded systems, software, data science, and civil experts, to refine my understanding. This involved:
- Identifying useful BSM elements for potential features.
- Visiting the hardware lab to understand on-board units (OBUs) that gather the BSMs.
- Evaluating the format and usability of data elements (e.g., on/off flags, floating values).

Mapping BSM elements to potential events
Next, I worked closely with the team, especially systems engineers and data scientists, to determine how different BSMs could be combined to infer roadway conditions with the highest degrees of certainty possible. This involved:
- Identifying which BSM elements could be used together to create meaningful insights.
- Working with engineers to ensure the data format was suitable for real-time analysis.
- Brainstorming specifics and logic that could be used in algorithms.
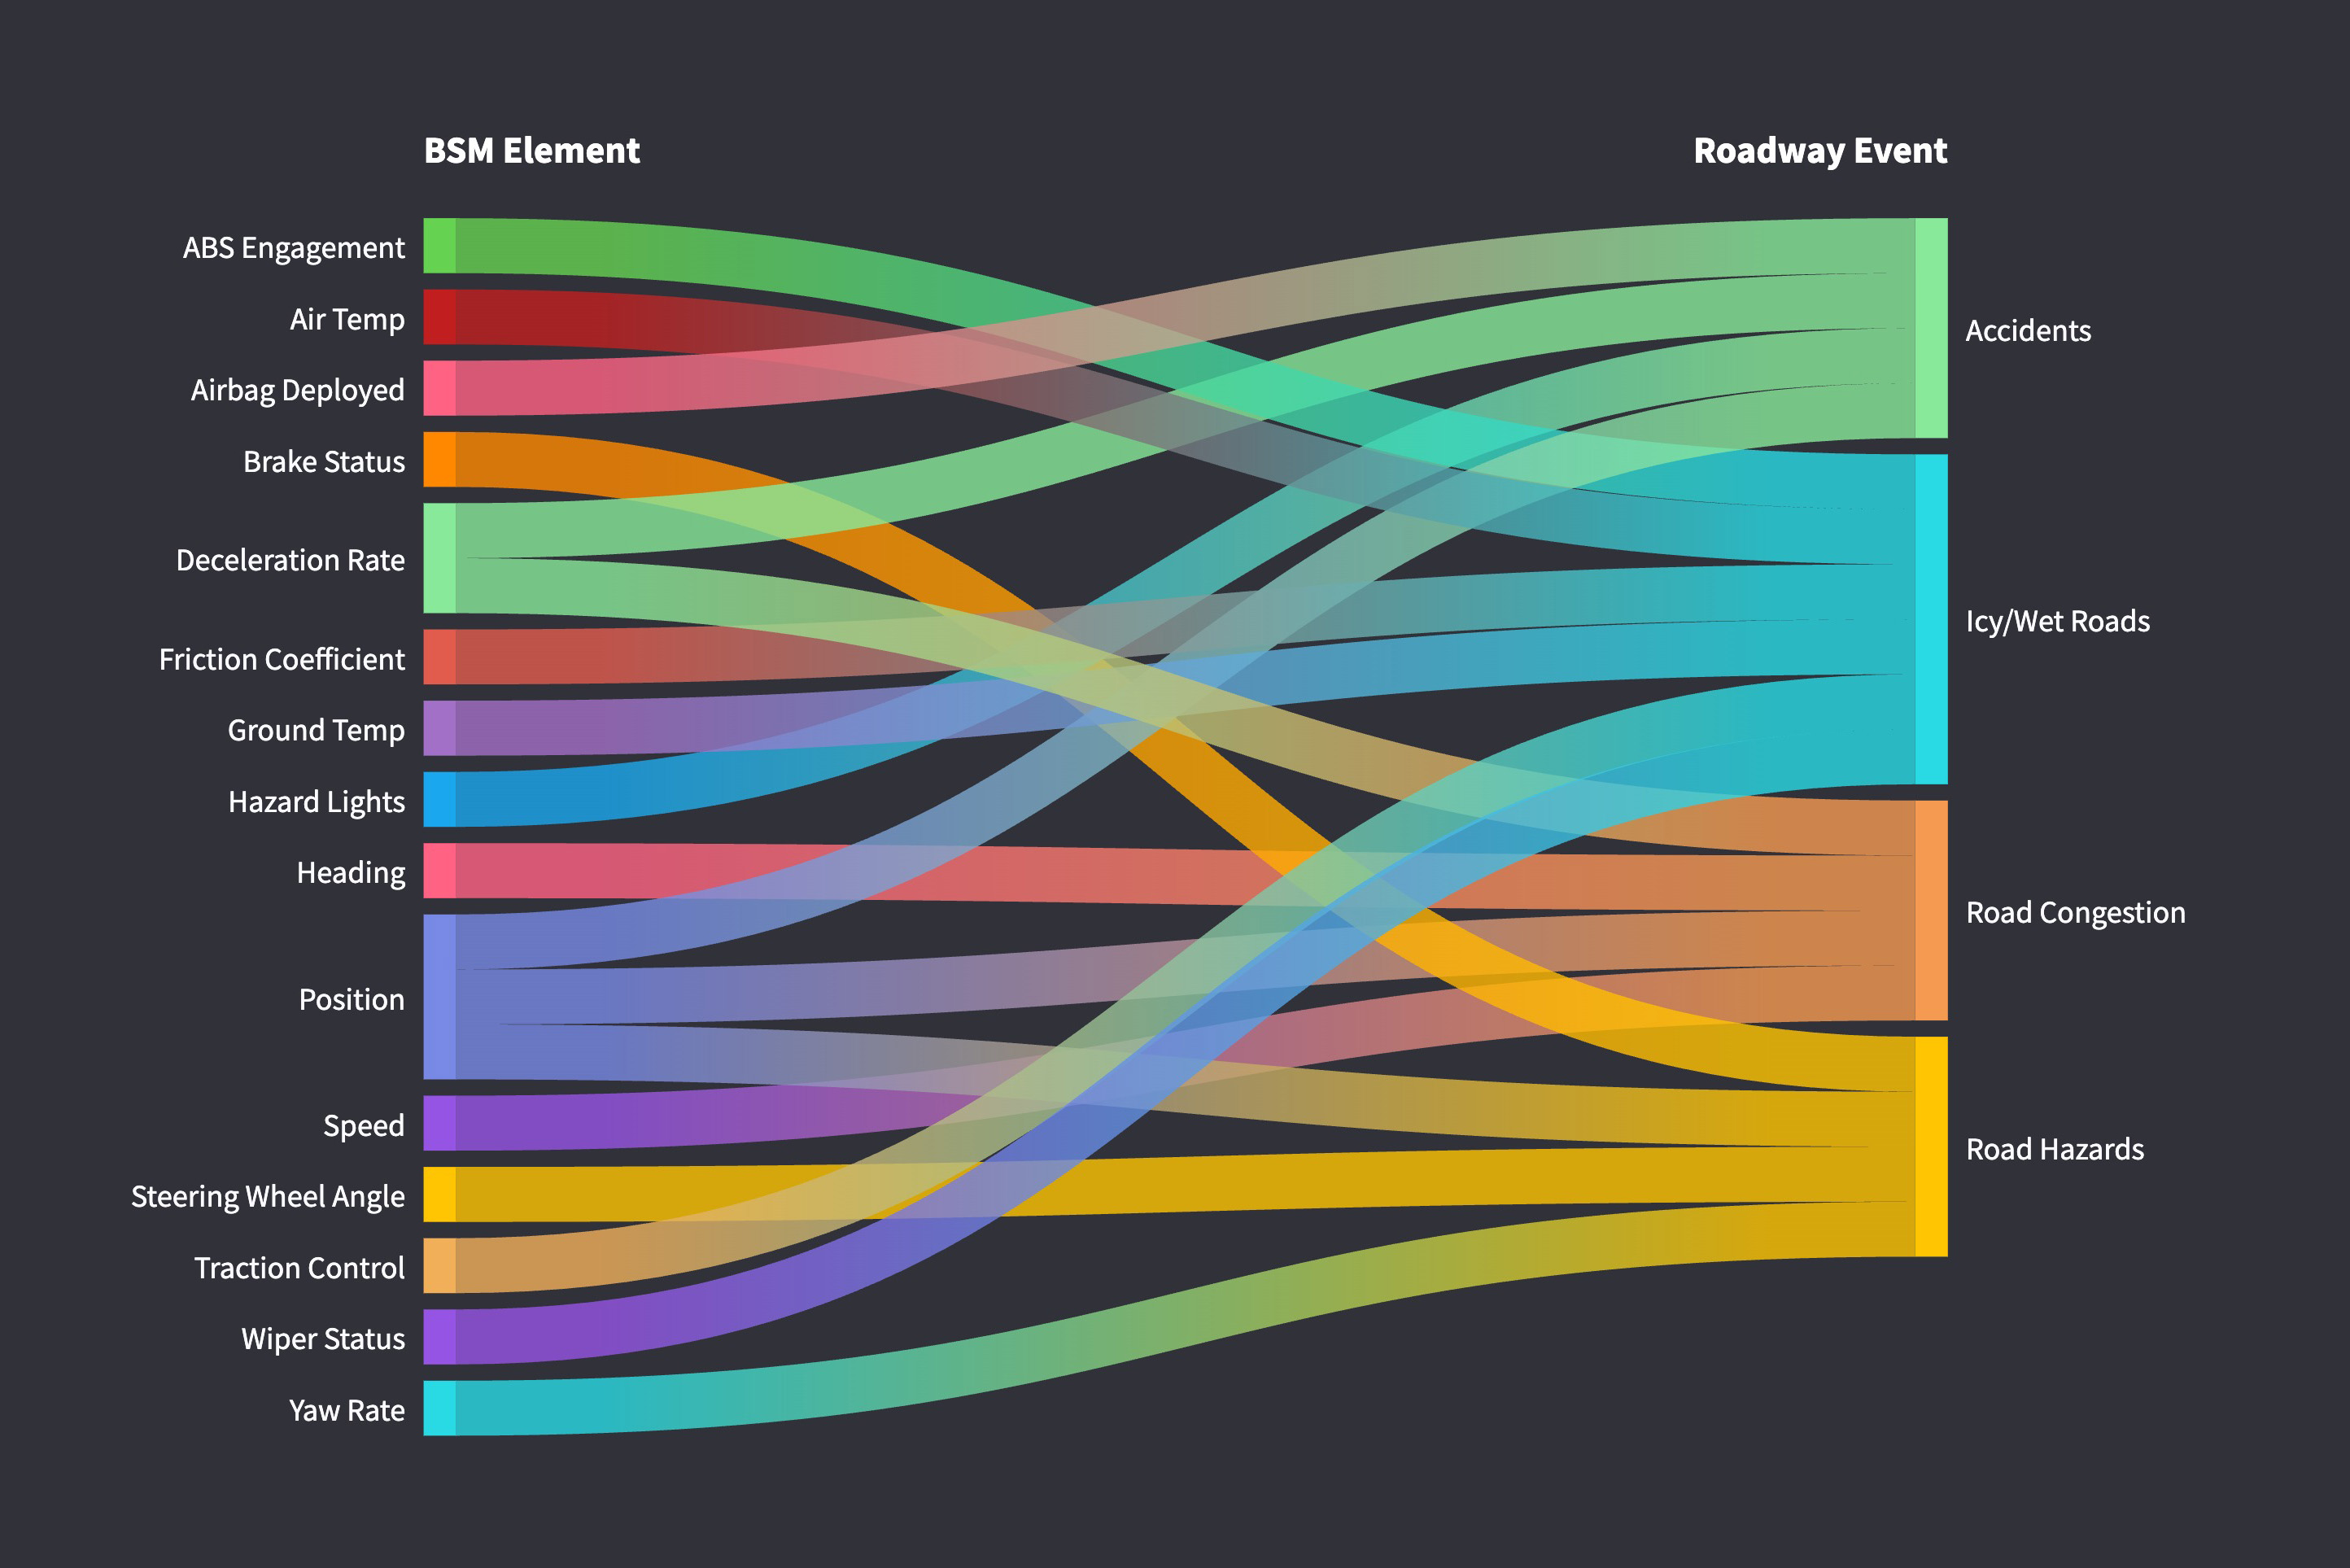 BSM elements were mapped to
potential roadway conditions or events.
BSM elements were mapped to
potential roadway conditions or events.
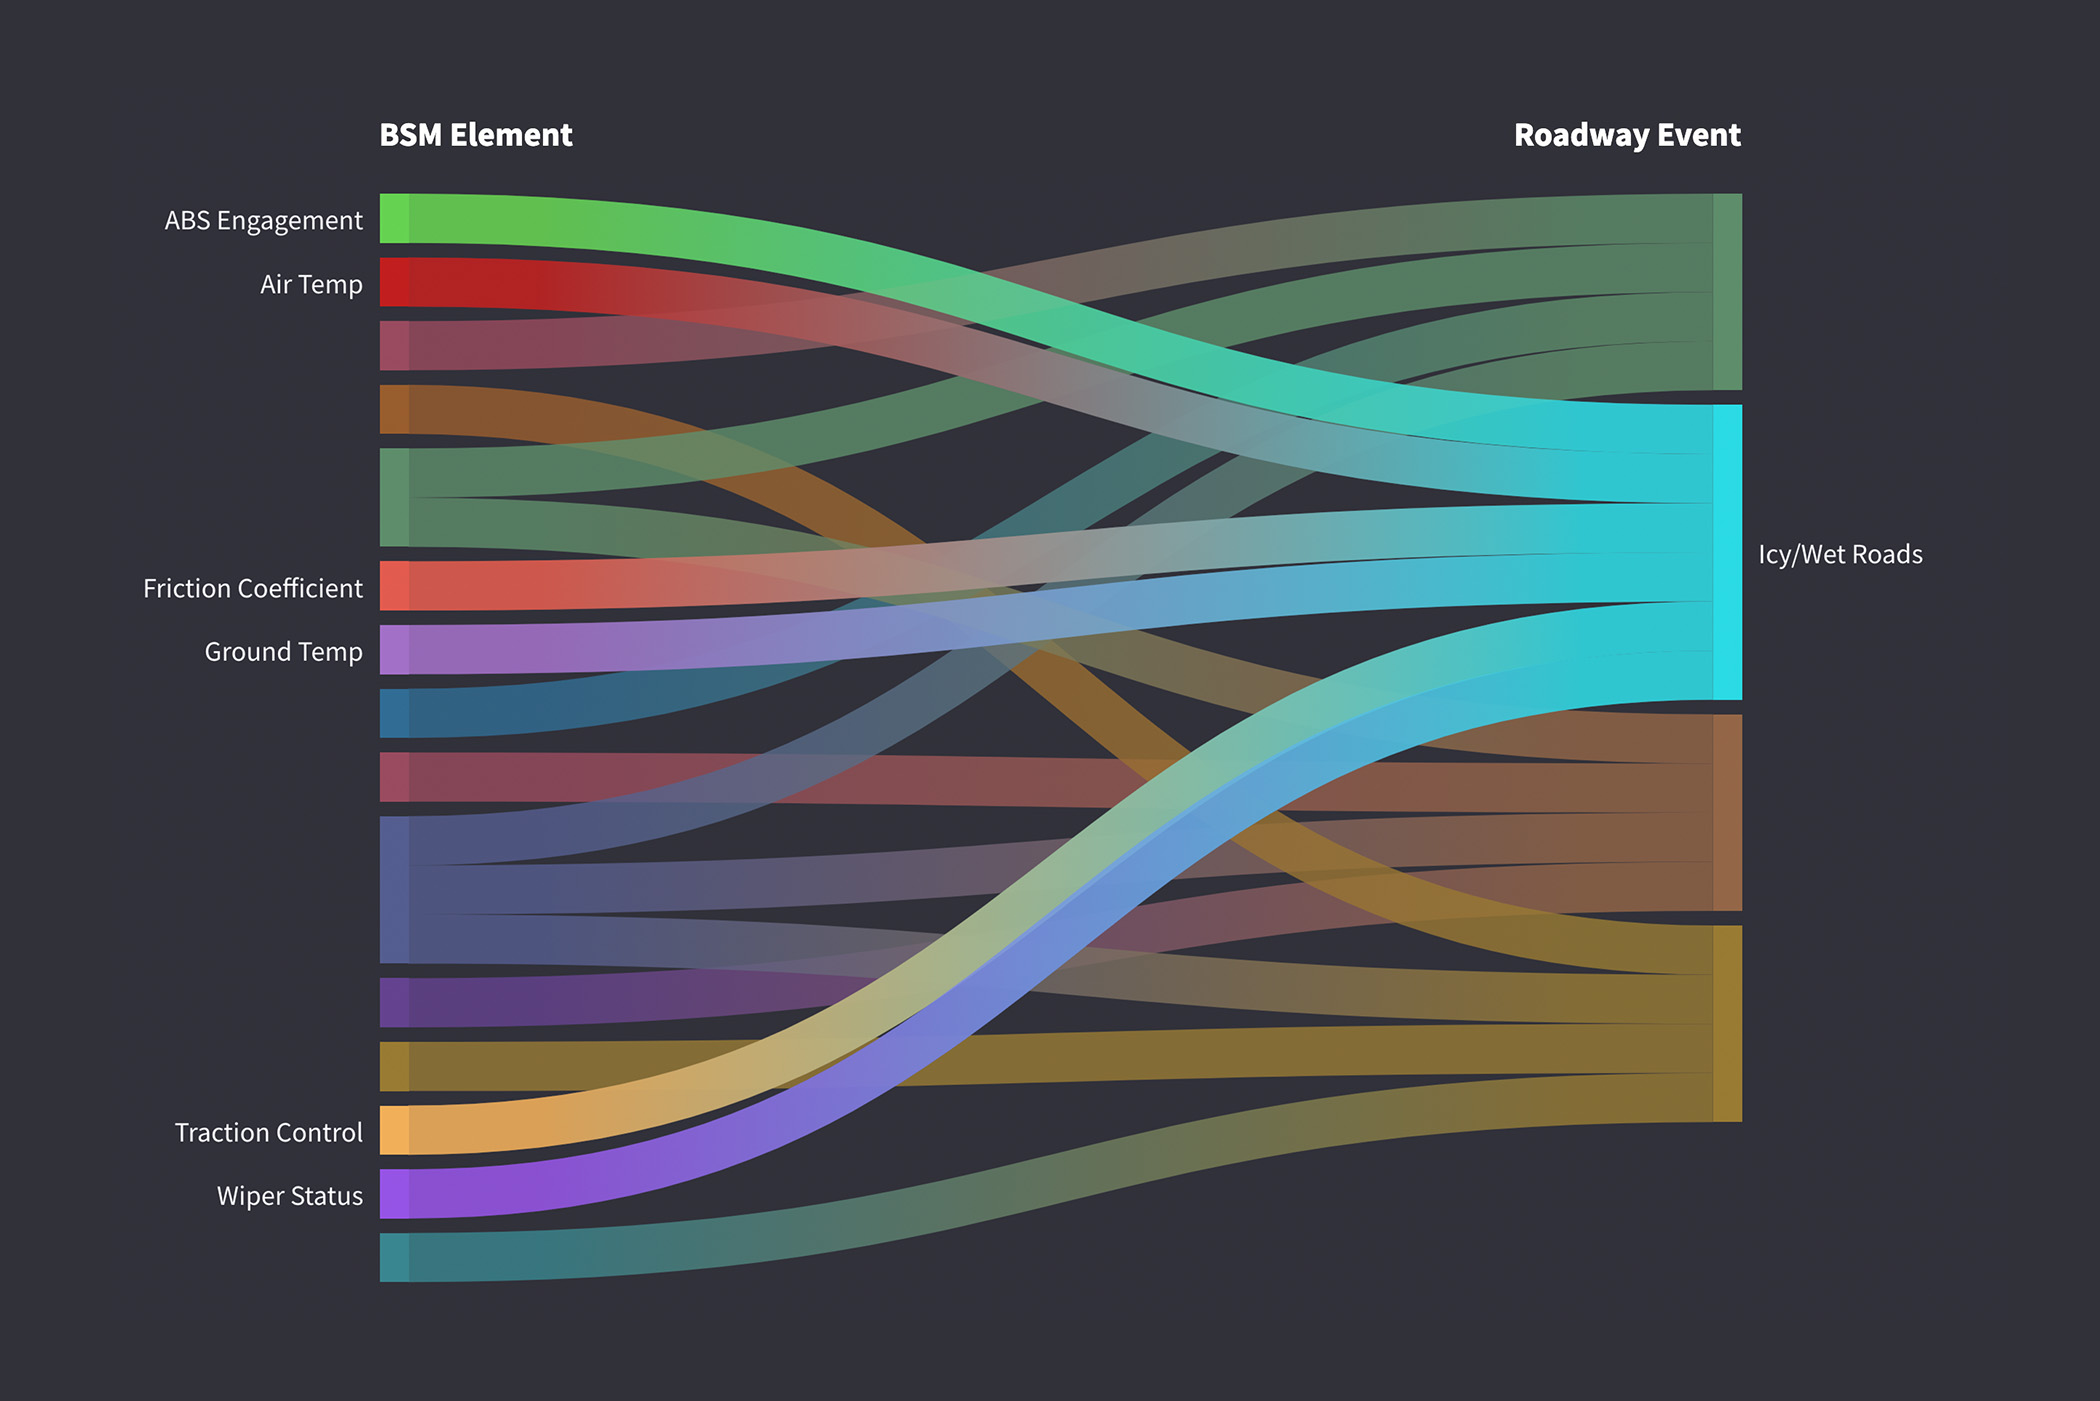 Wet roads can change to icy in
an instant.
Wet roads can change to icy in
an instant.
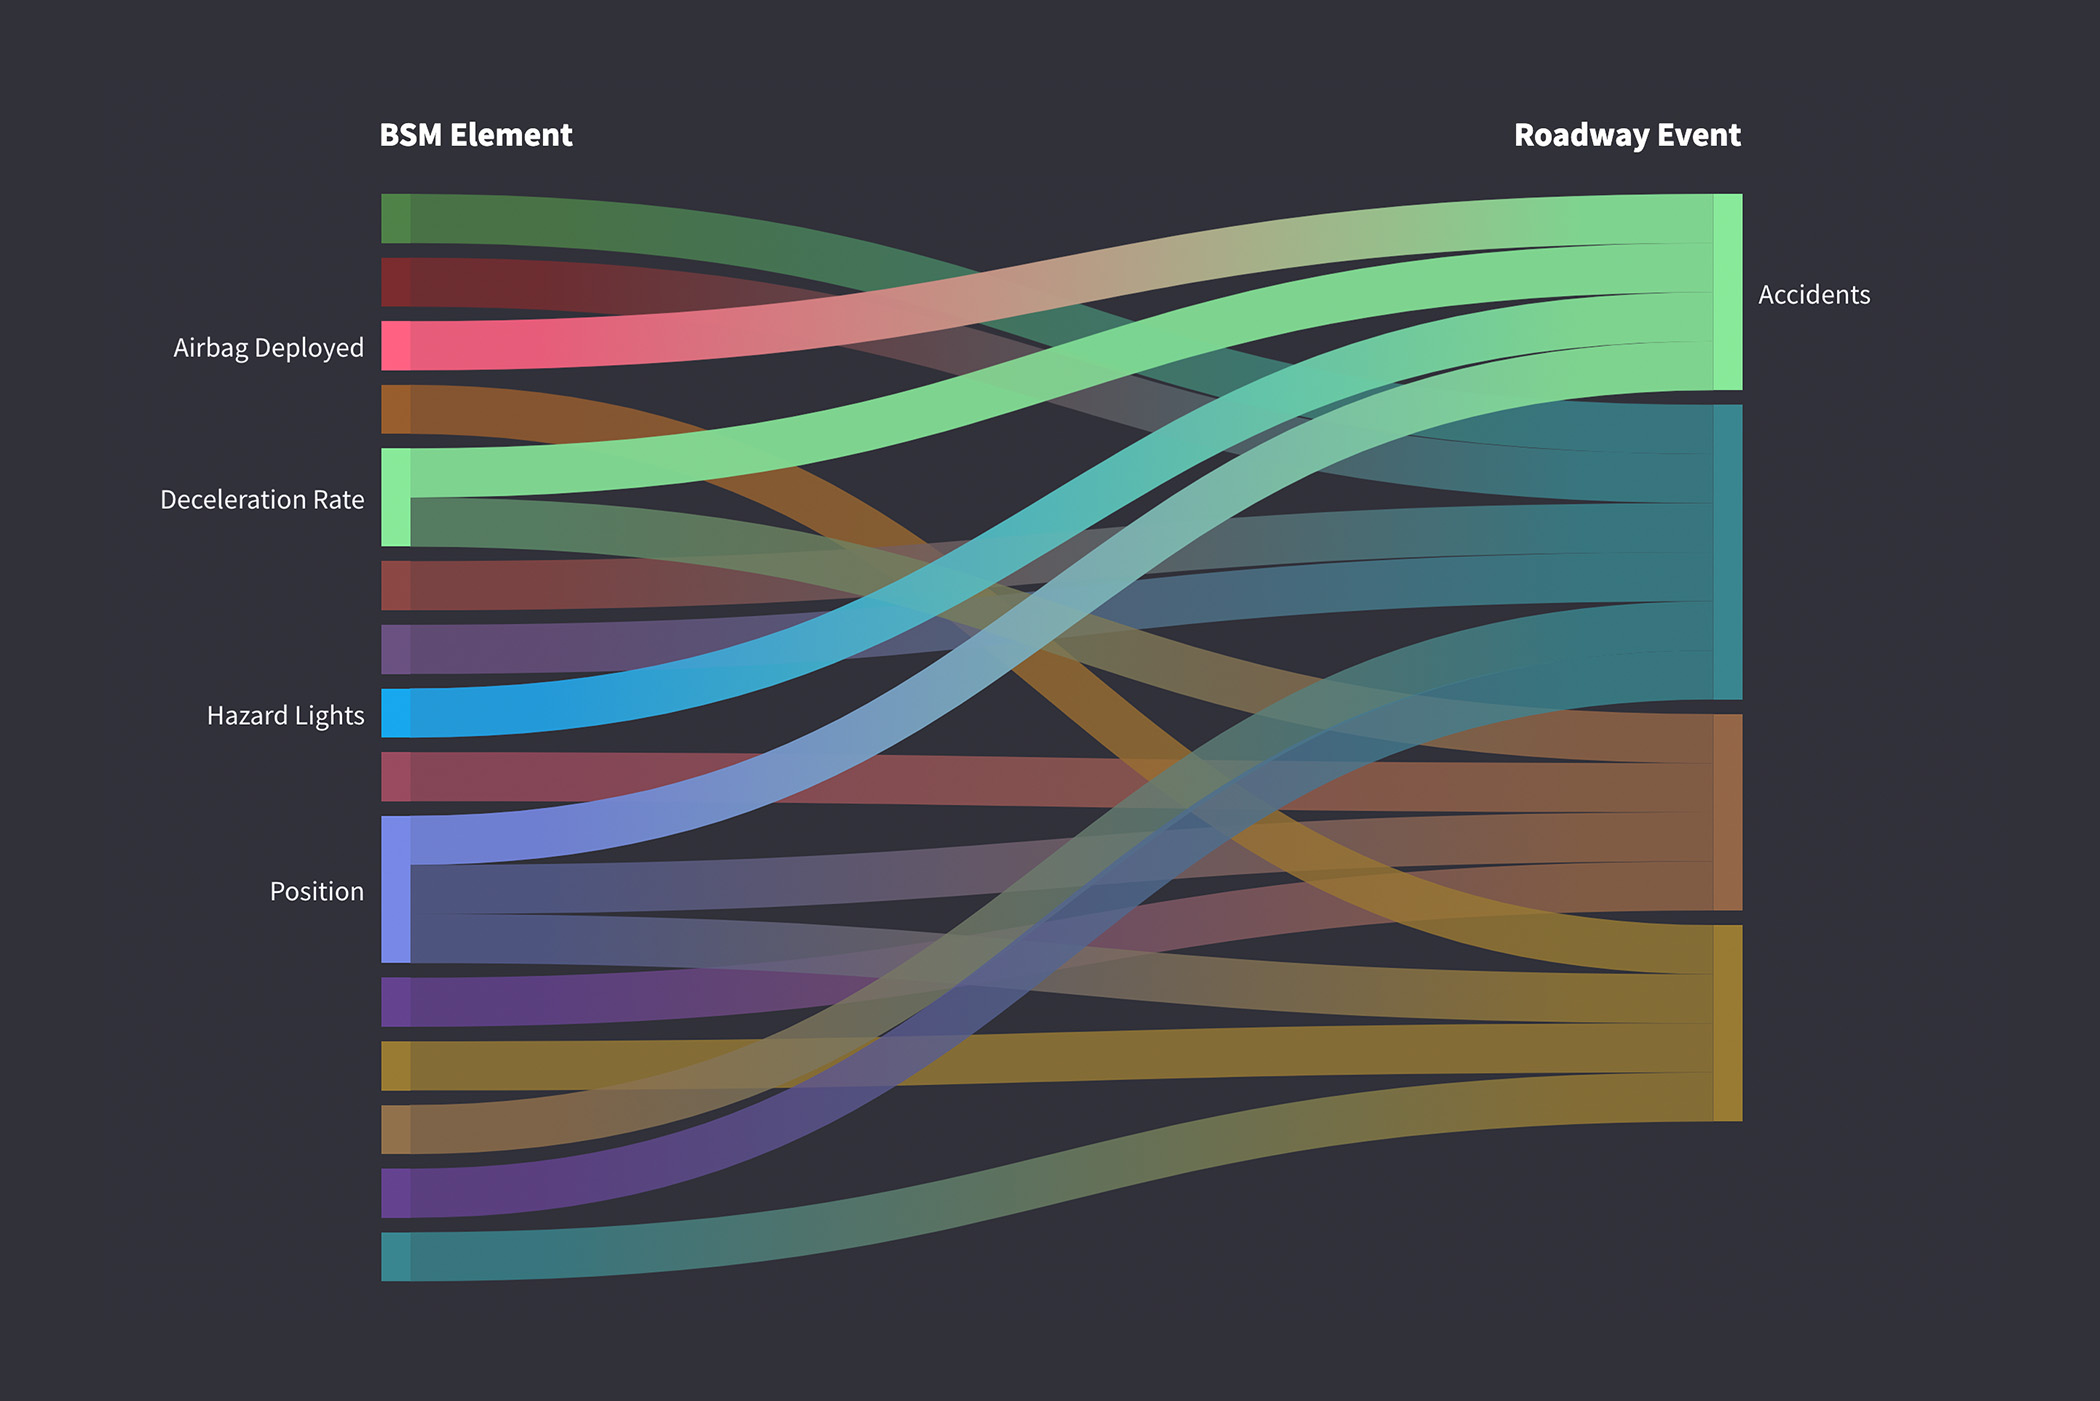 Accidents are dangerous to the
vehicle(s) involved and raise the odds for secondary accidents.
Accidents are dangerous to the
vehicle(s) involved and raise the odds for secondary accidents.
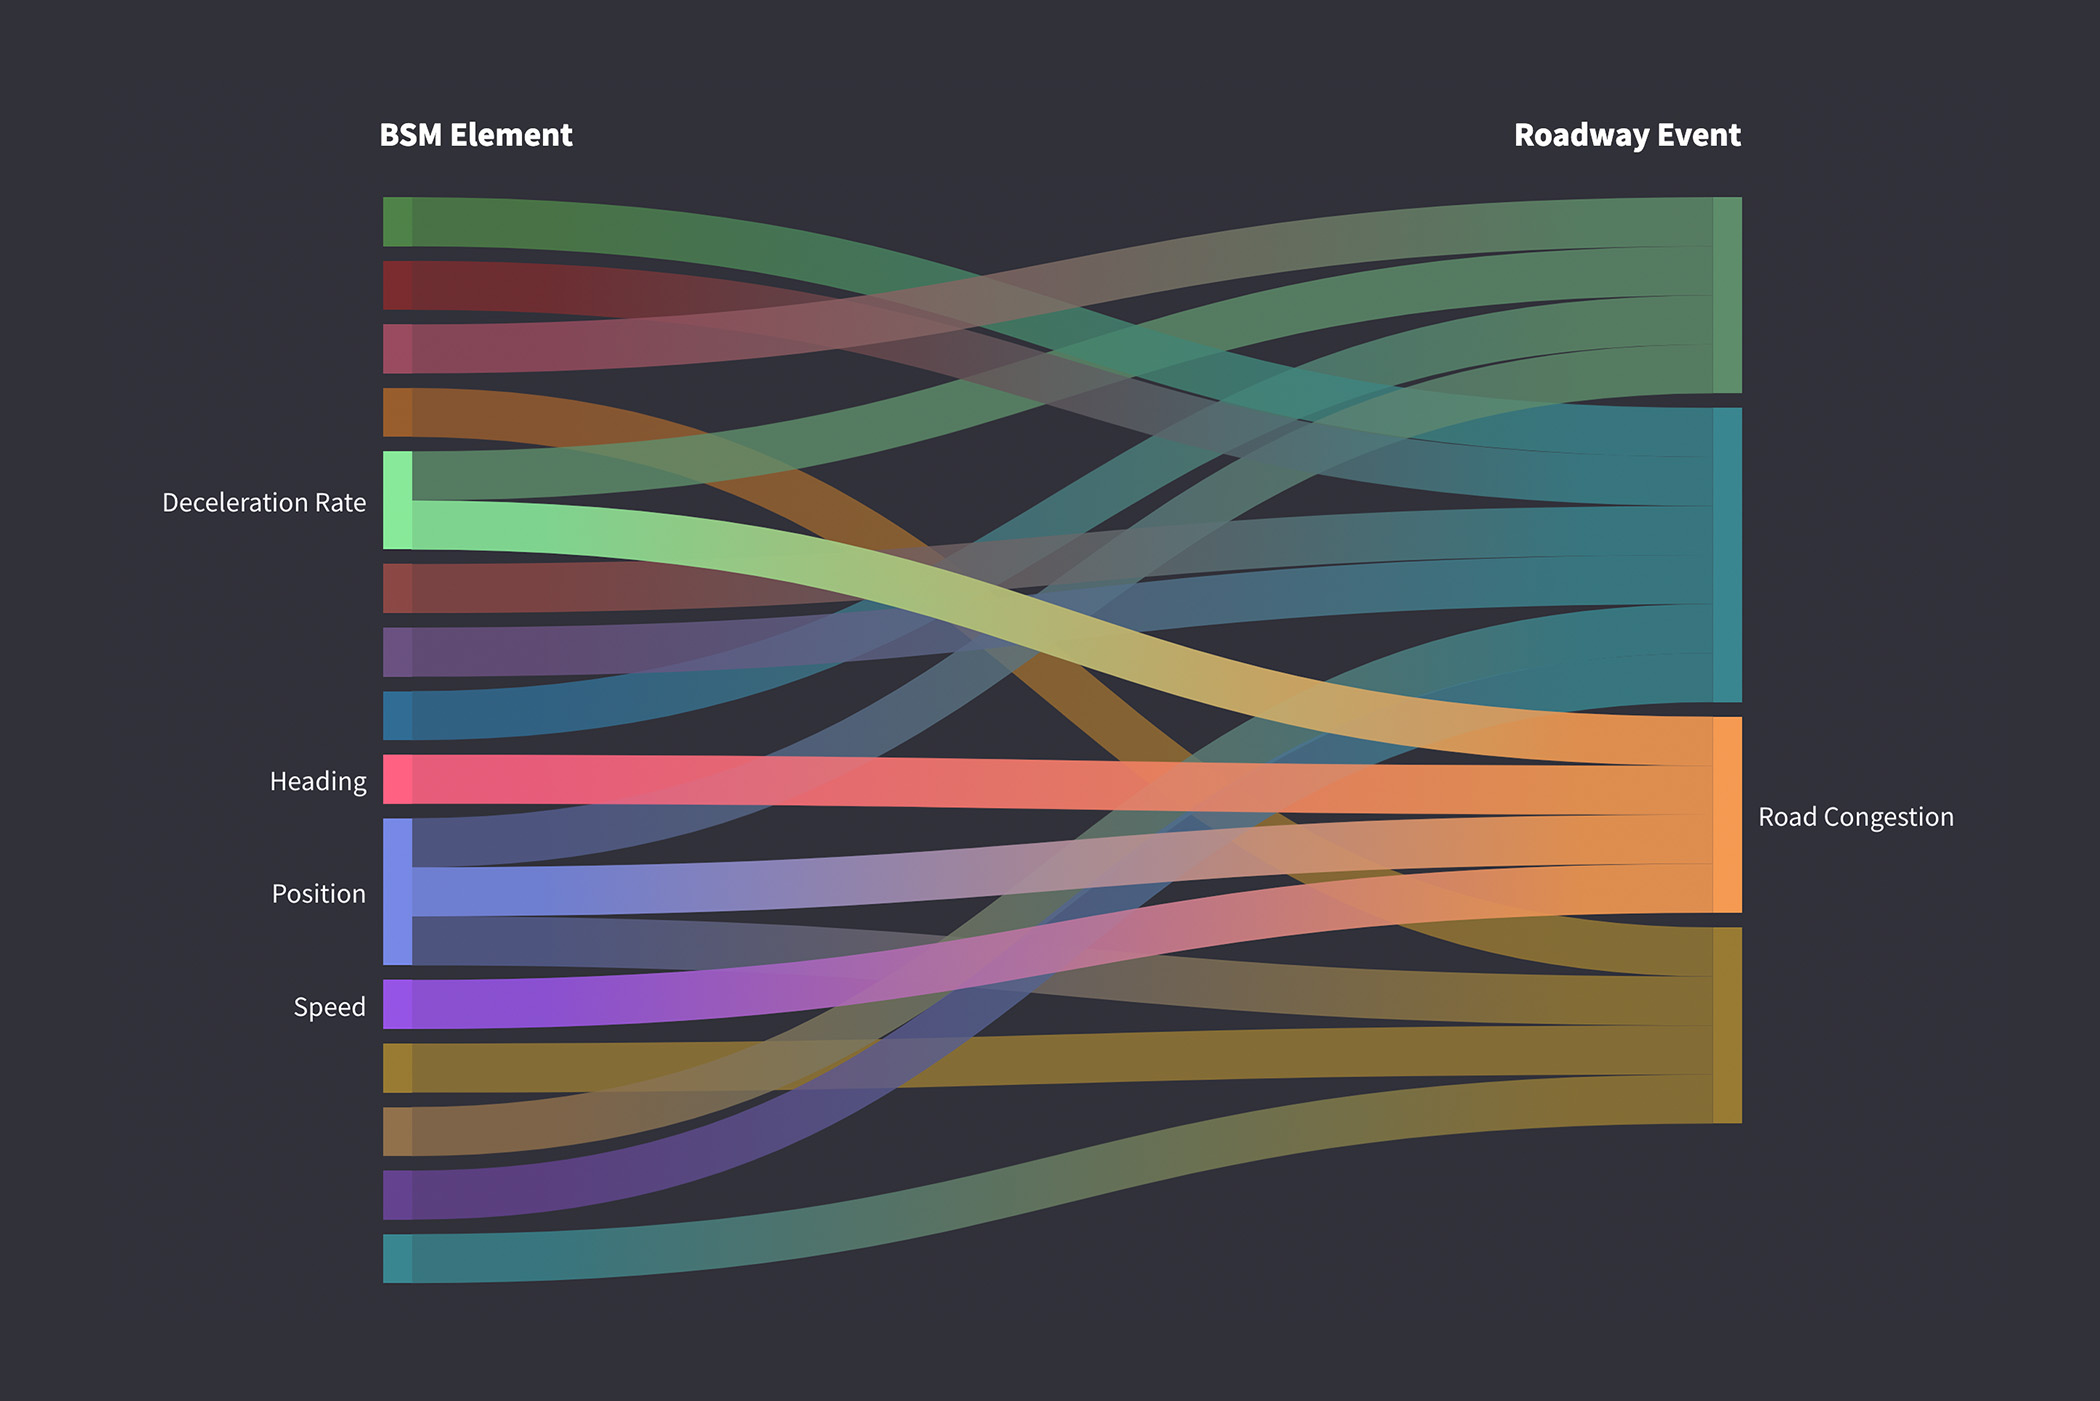 Congestion was a project
focus, but also increases risks for accidents.
Congestion was a project
focus, but also increases risks for accidents.
 Road hazards could be any
obstruction on the roadways.
Road hazards could be any
obstruction on the roadways.
Collaboration refines design direction
Through close team collaboration with various engineers and SMEs I gained a better understanding about the technical constraints and feasibility within a V2X system. Afterwards, I was able to better approach the system design and the initial features to we could use to create a viable MVP for the market.
V.
Prioritizing system features for MVP Development
As we moved from concept to implementation, the primary focus was on developing an MVP that could showcase the product's current value and potential for future scalability. While managing large data sets remained an ongoing challenge, my immediate task was to simplify these continuous data streams into clear, actionable roadway insights. This effort was crucial not only for demonstrating the product's capabilities but also for laying the foundation for its future evolution.
How might we ...
How might we distill continuous, raw BSM data streams into intuitive, real-time, and actionable insights for non-technical users?
VI.
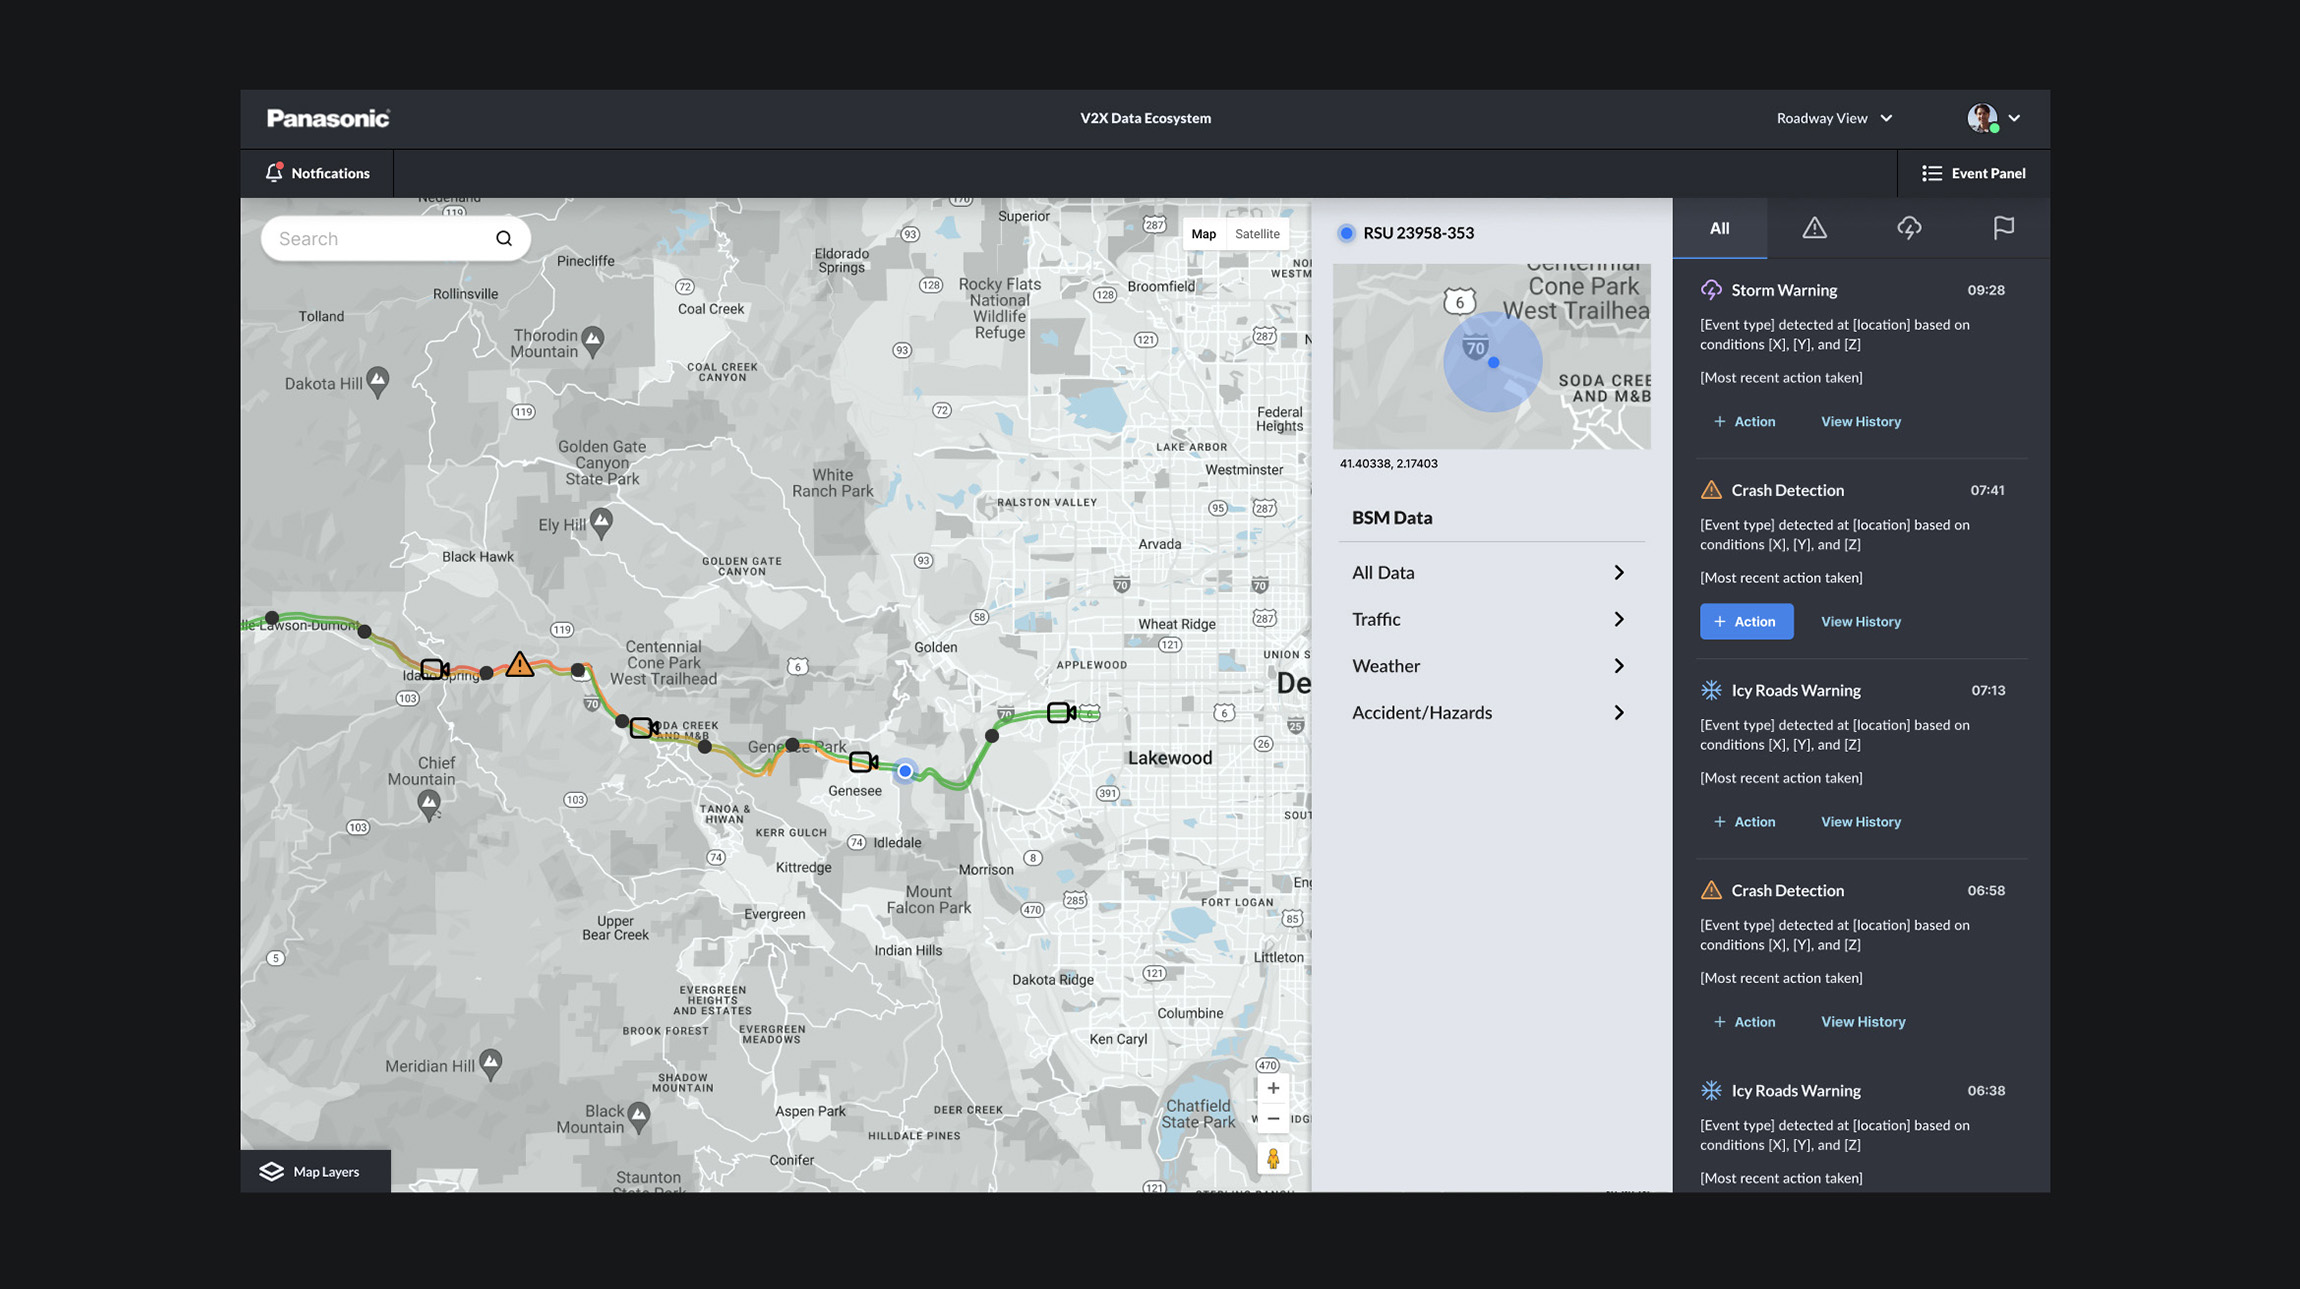
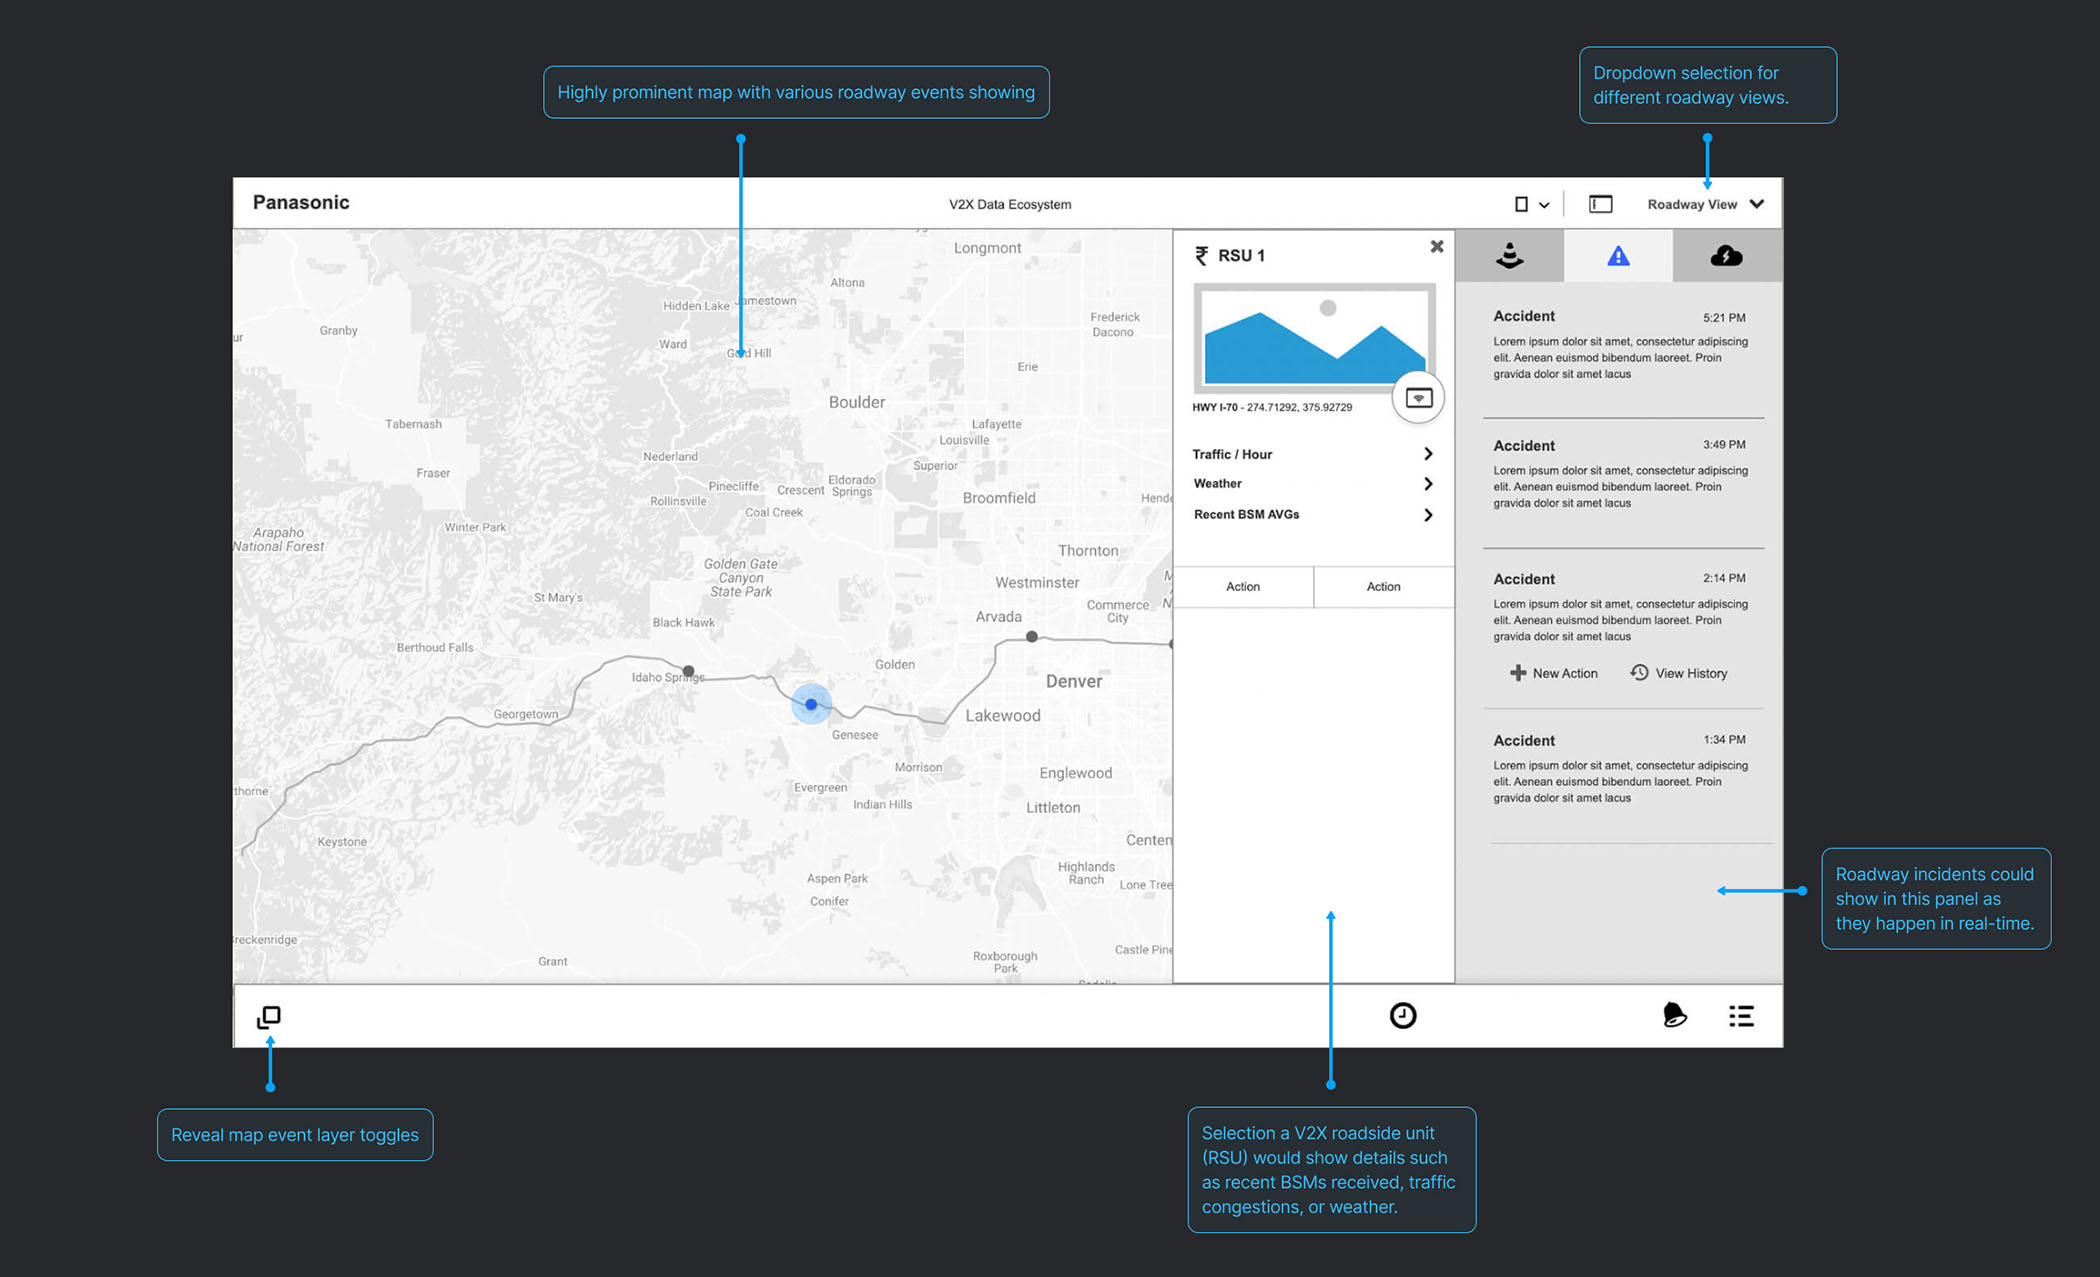
Transforming V2X data into actionable insights
By applying a systems thinking approach, I collaborated with the team to simplify the complexities of the V2X data ecosystem. I focused on distilling the vast data streams into the most critical information, ensuring that operators could quickly gain the insights needed to improve traffic management and roadway safety.
Solidifying content hierarchy
Understanding that the interface would be map-focused, I began by exploring existing map-based applications such as Google Maps, Waze, and others to gather inspiration and identify best practices. This exploration directly informed the way I structured the content hierarchy, ensuring that the most critical information was prioritized and easily accessible to traffic operators.
- Exploration and Inspiration: Analyzed existing map-based applications to gather best practices in user interaction, data visualization, and overall usability.
- Content Hierarchy: Leveraged these insights to organize and prioritize UI elements, making sure that essential data was front and center, enabling operators to make quick and informed decisions.

Refining wires in mid-fidelity
With a clear content hierarchy in place, I moved on to exploring various UI layouts to determine the most effective way to present the prioritized information. The goal was to create an intuitive interface that could efficiently deliver critical real-time data. This exploration culminated in the development of wireframes, which served as the blueprint for the subsequent design stages.
- Layout Exploration: Evaluated and experimented with different UI layouts, focusing on map-based visualization as the centerpiece.
- Wireframe Development: Created wireframes that reflected the chosen layouts, incorporating feedback and refining the designs to ensure they met the project's goals.
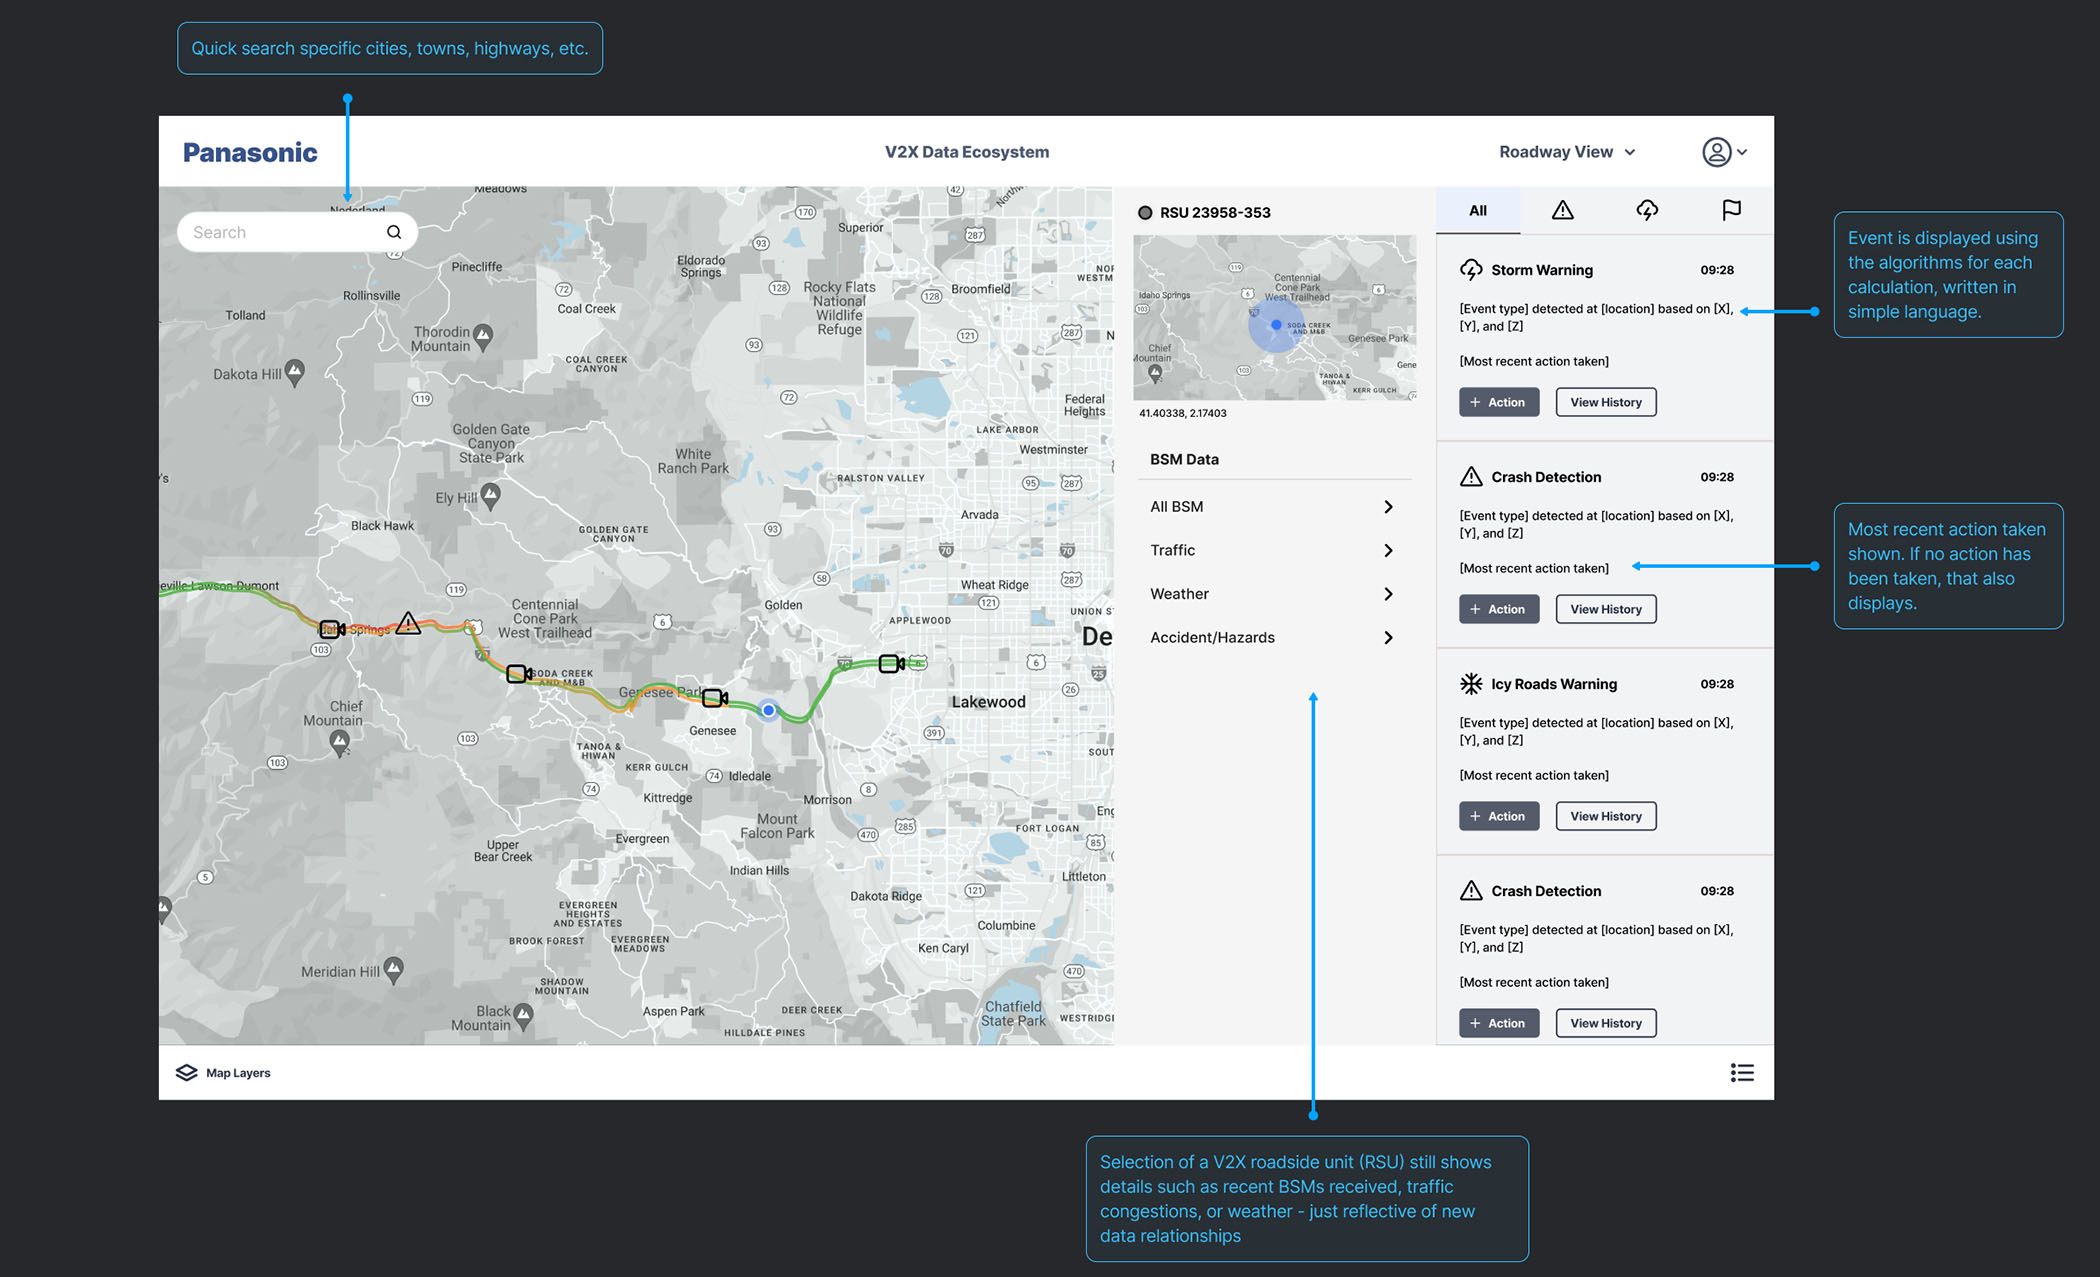 BSM data mapping to events
provided a clearer picture for how different events get generated
BSM data mapping to events
provided a clearer picture for how different events get generated
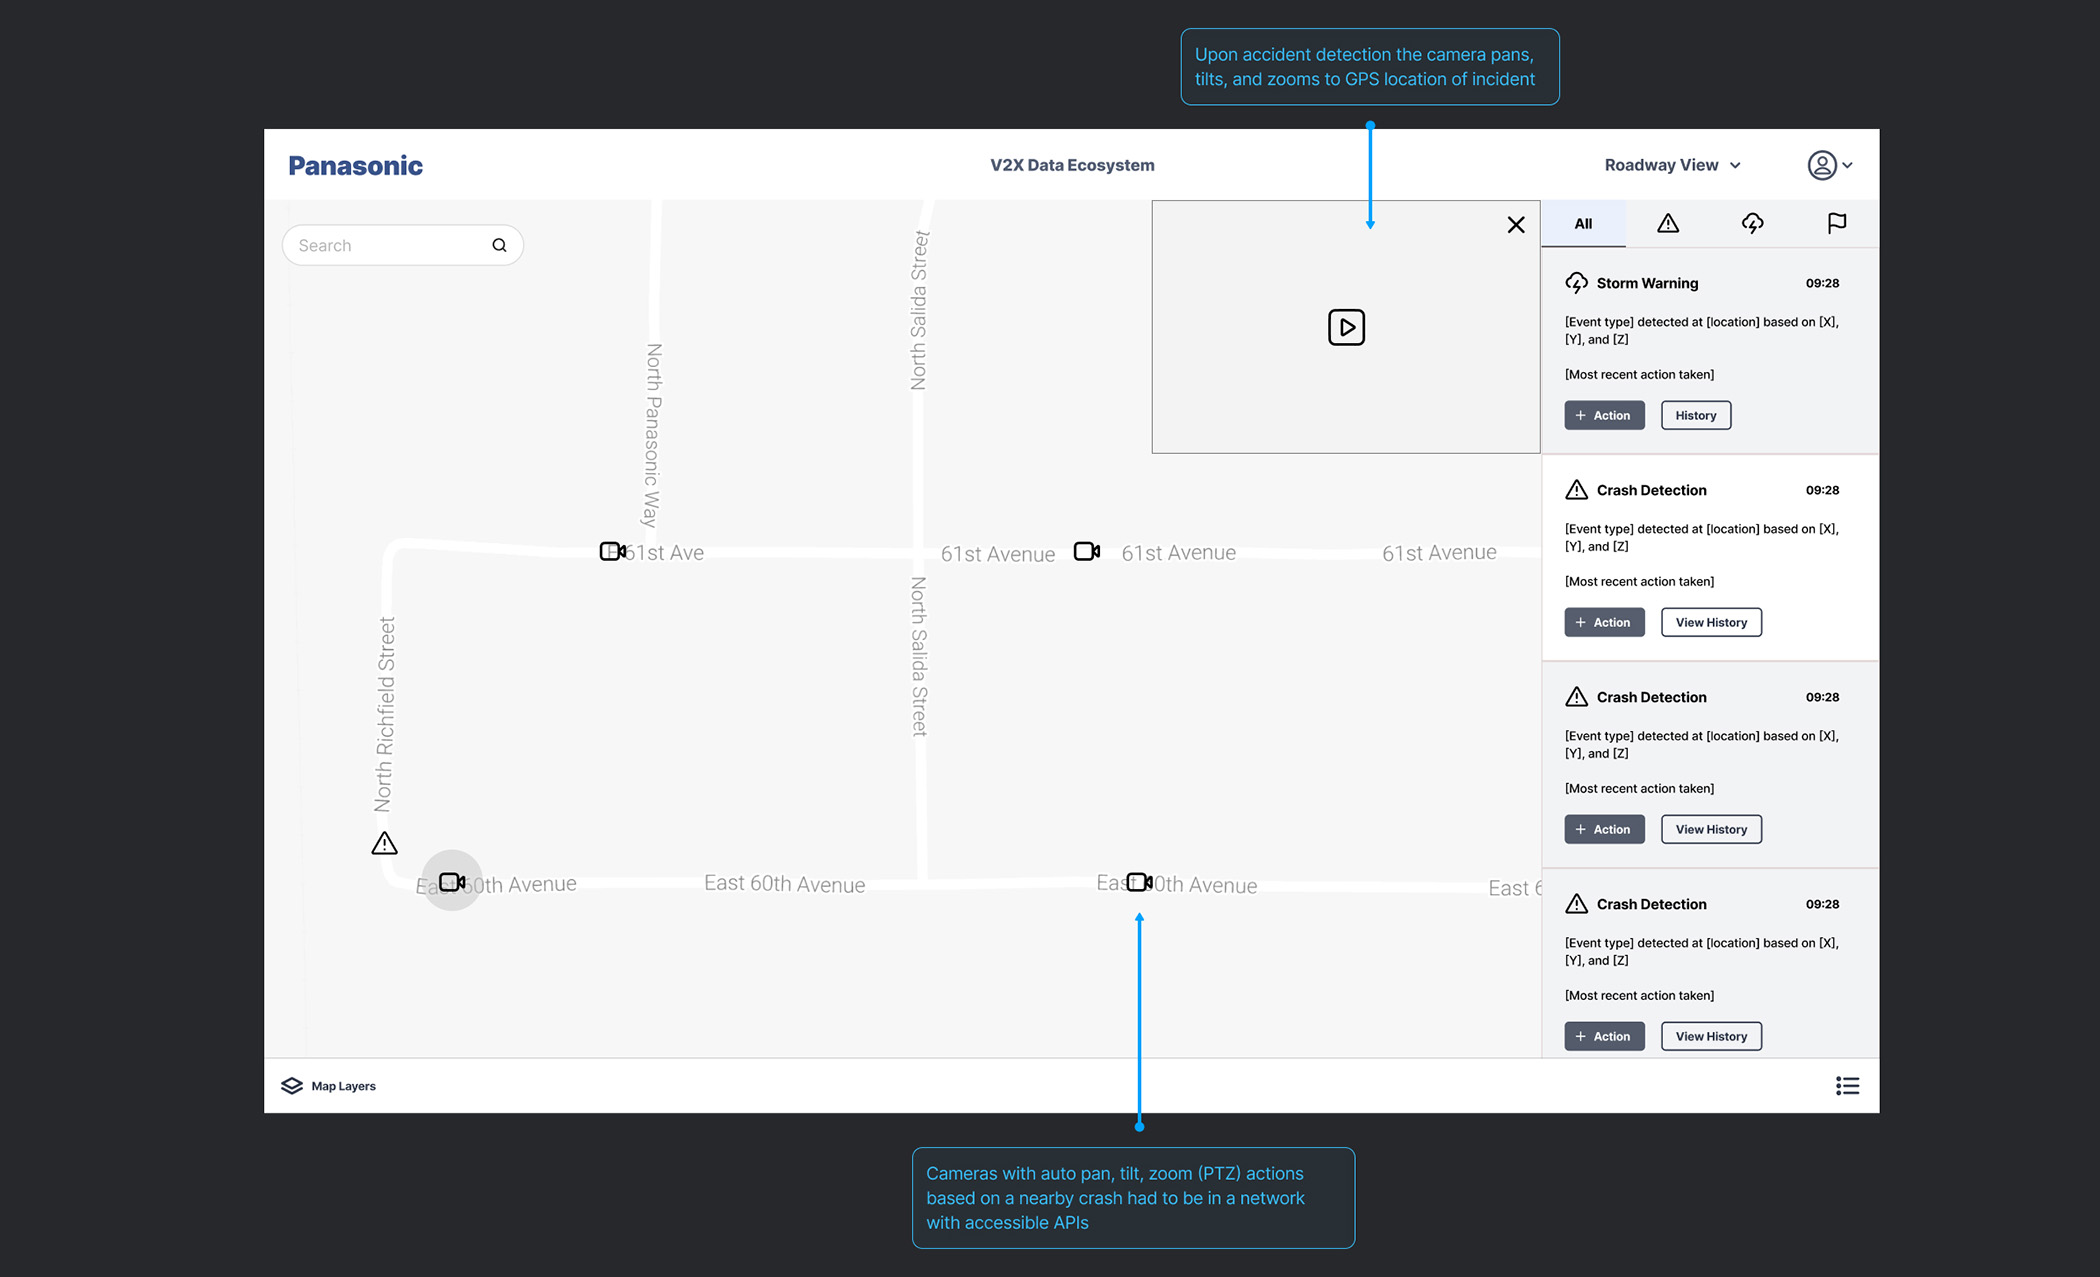 Automatic camera features can
be tied to events as long as the API is exposed.
Automatic camera features can
be tied to events as long as the API is exposed.
More alignment and technical feasibility
With the updated wireframes, I circled back with the dev team and leadership for more discussion and feedback. These changes and new logic definitions aligned much better with our various data pipelines and capabilities at-the-moment.
Visual exploration
Following the refinement of the wireframes, I turned my attention to the visual aspects of the design, experimenting with various UI themes to find the most effective color schemes and styles. These themes were then translated into high-fidelity mockups, bringing the wireframes to life with polished, detailed UI designs.
Theme Exploration: Tested both light and dark color palettes, considering their impact on usability and visual clarity, especially in conjunction with the map-based visualization.
 Light themed UI, dark
themed map
Light themed UI, dark
themed map
 Dark themed UI, light
themed map
Dark themed UI, light
themed map
 Light themed UI, full
color map
Light themed UI, full
color map
 Dark themed UI, full
color map
Dark themed UI, full
color map
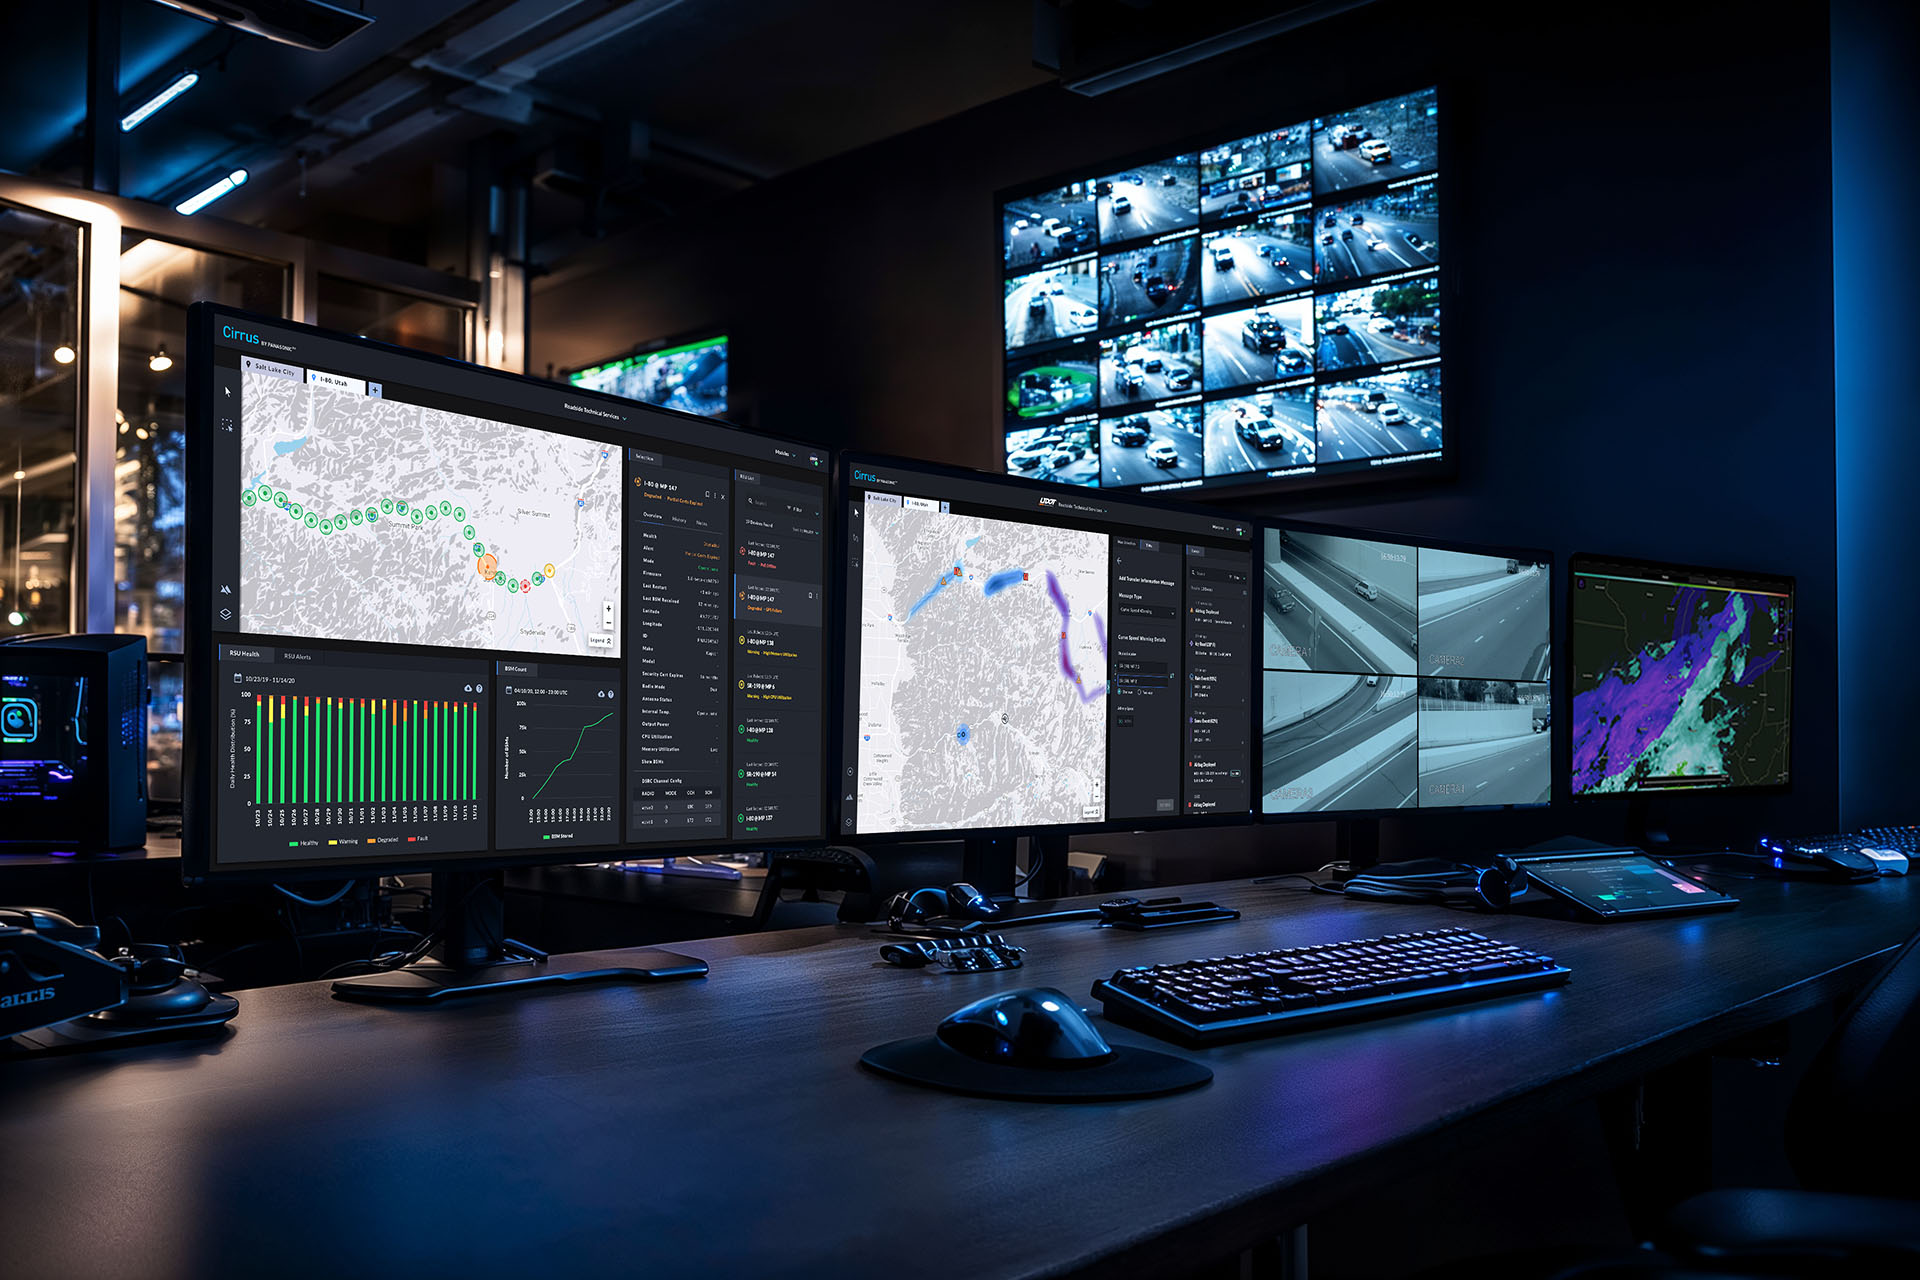
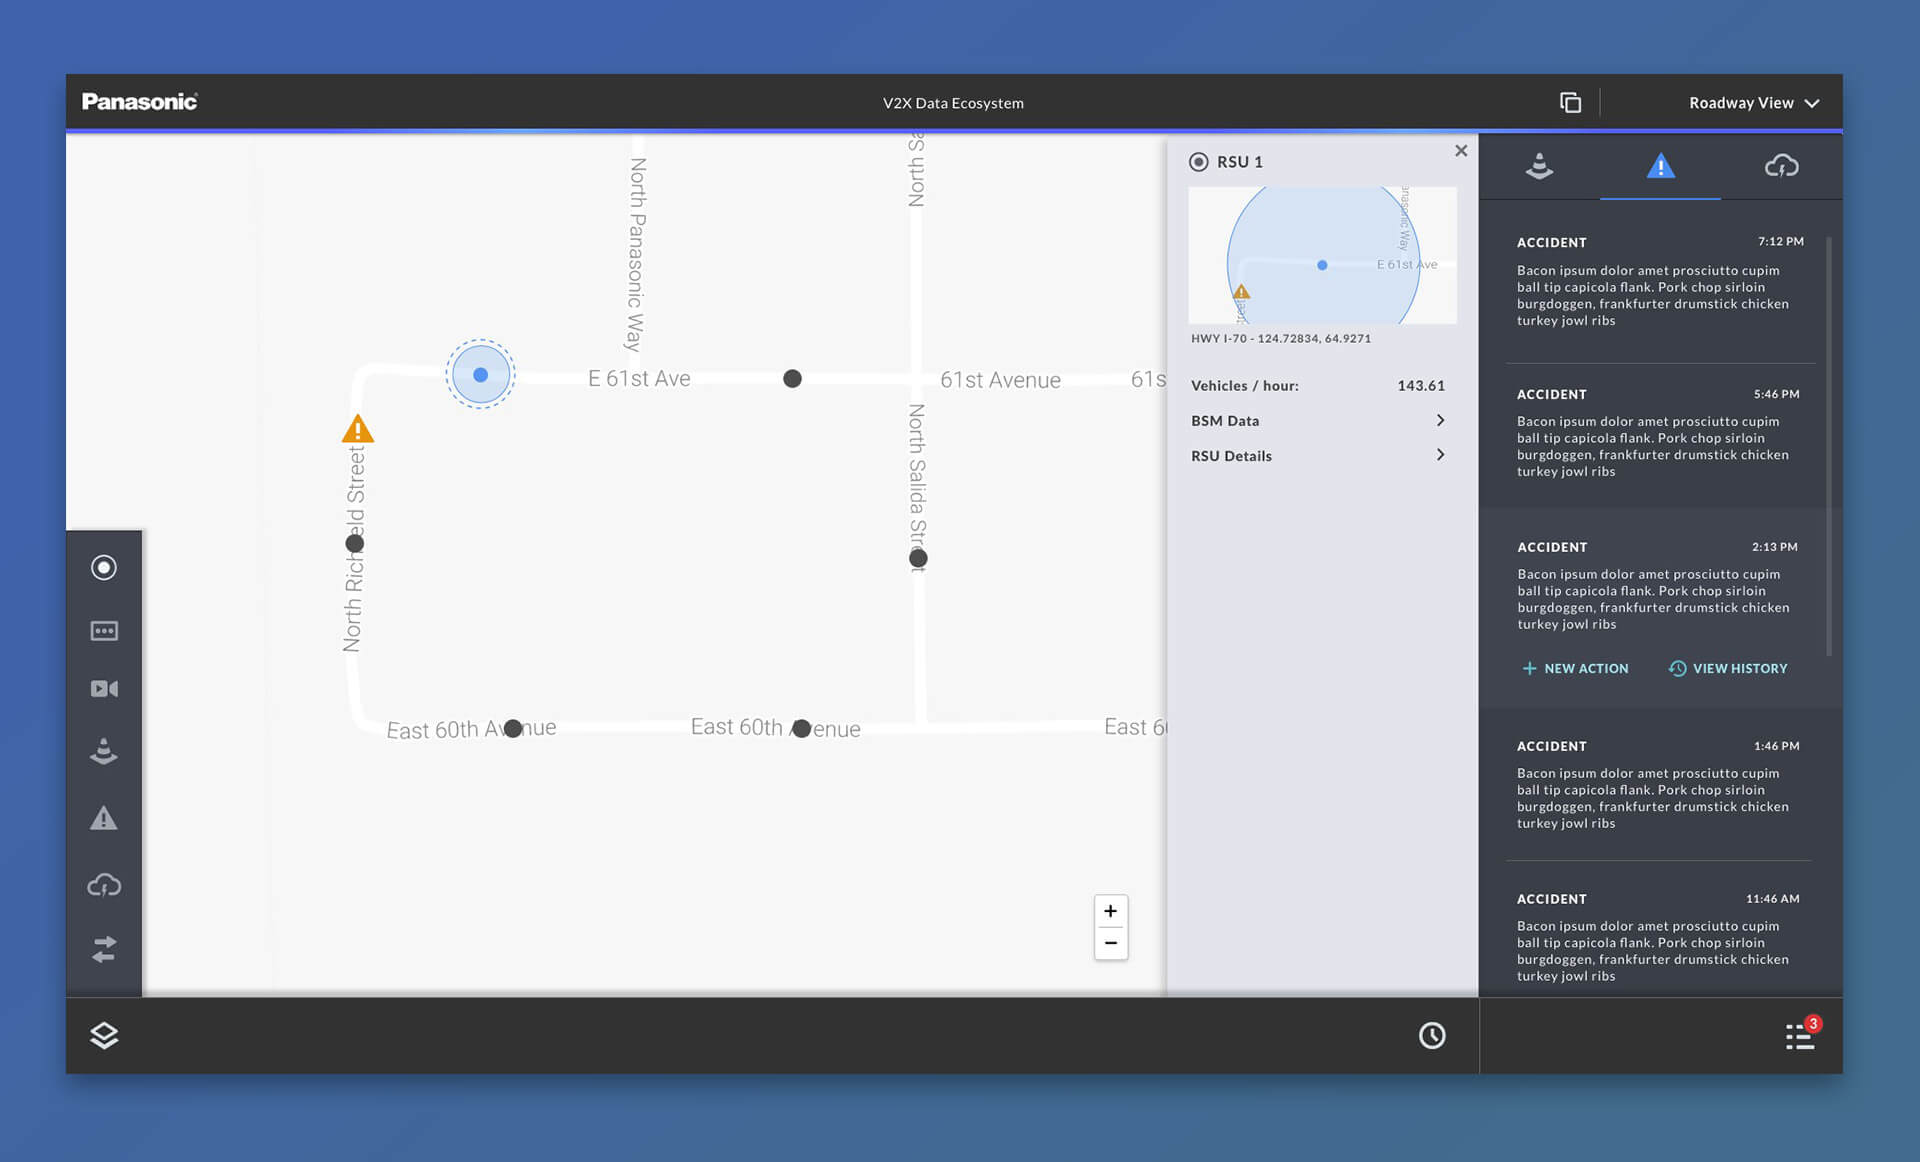
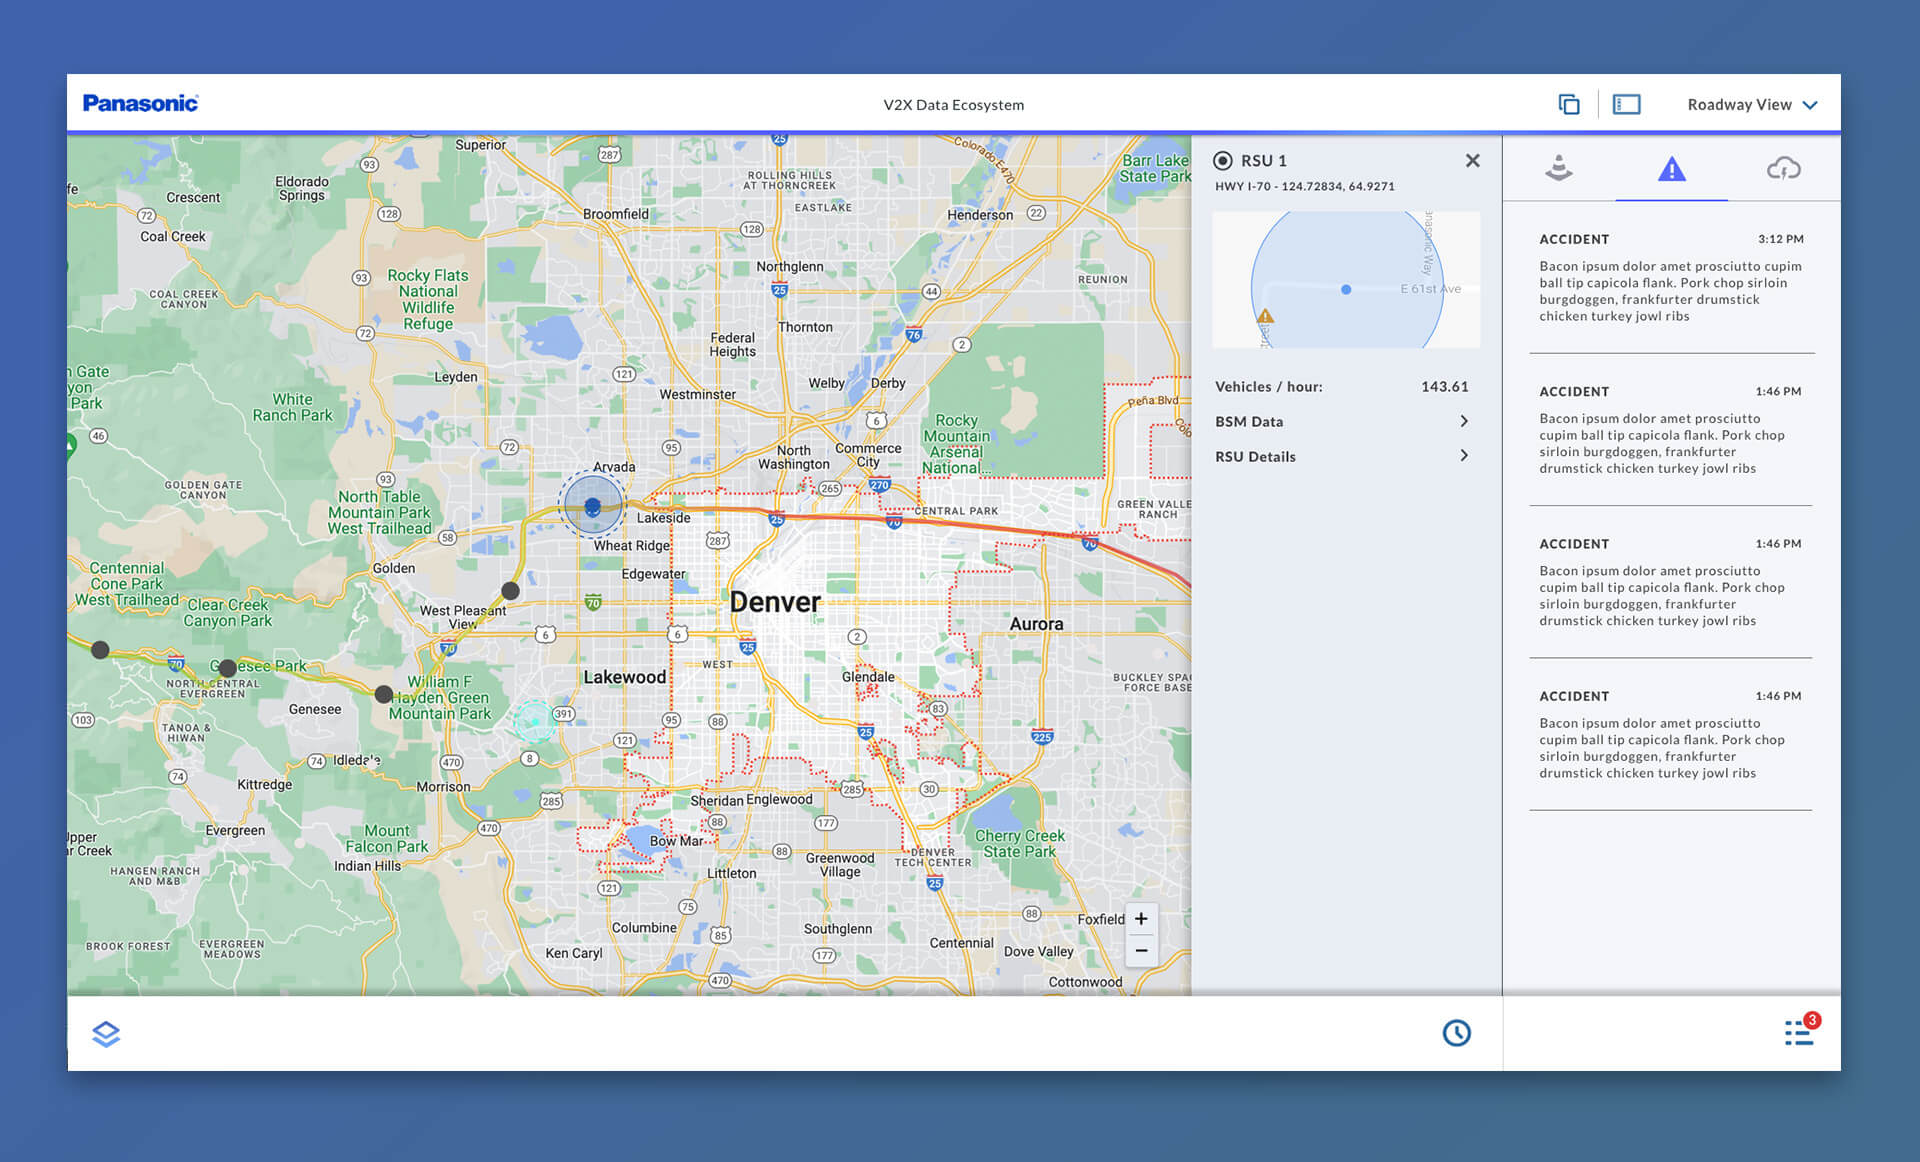
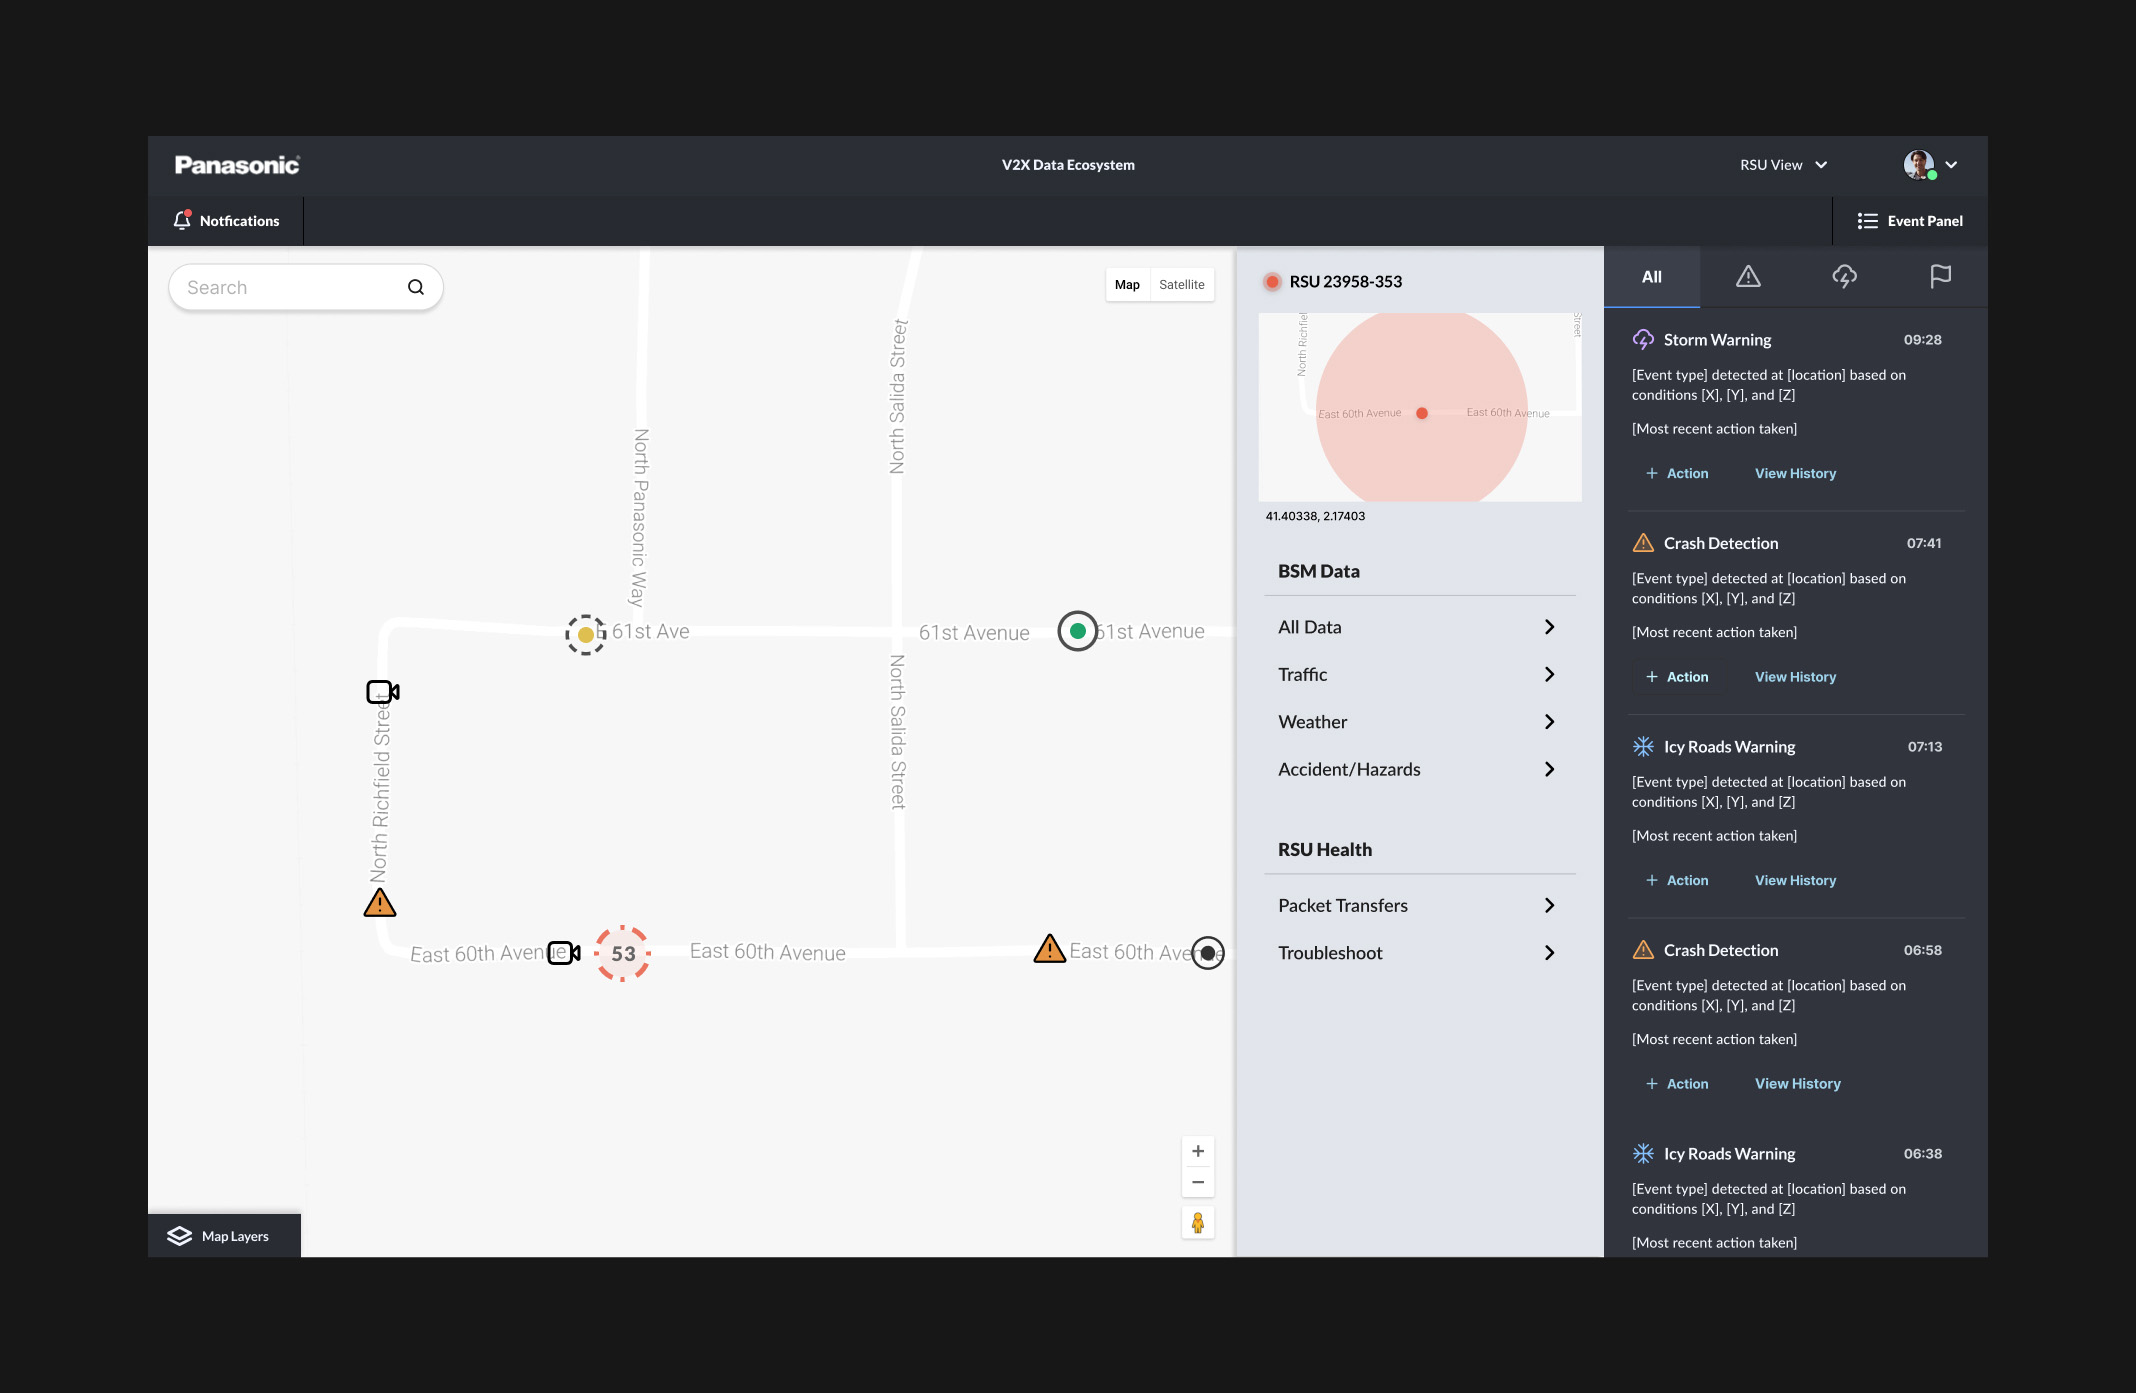
Balancing detail and simplicity in the UI
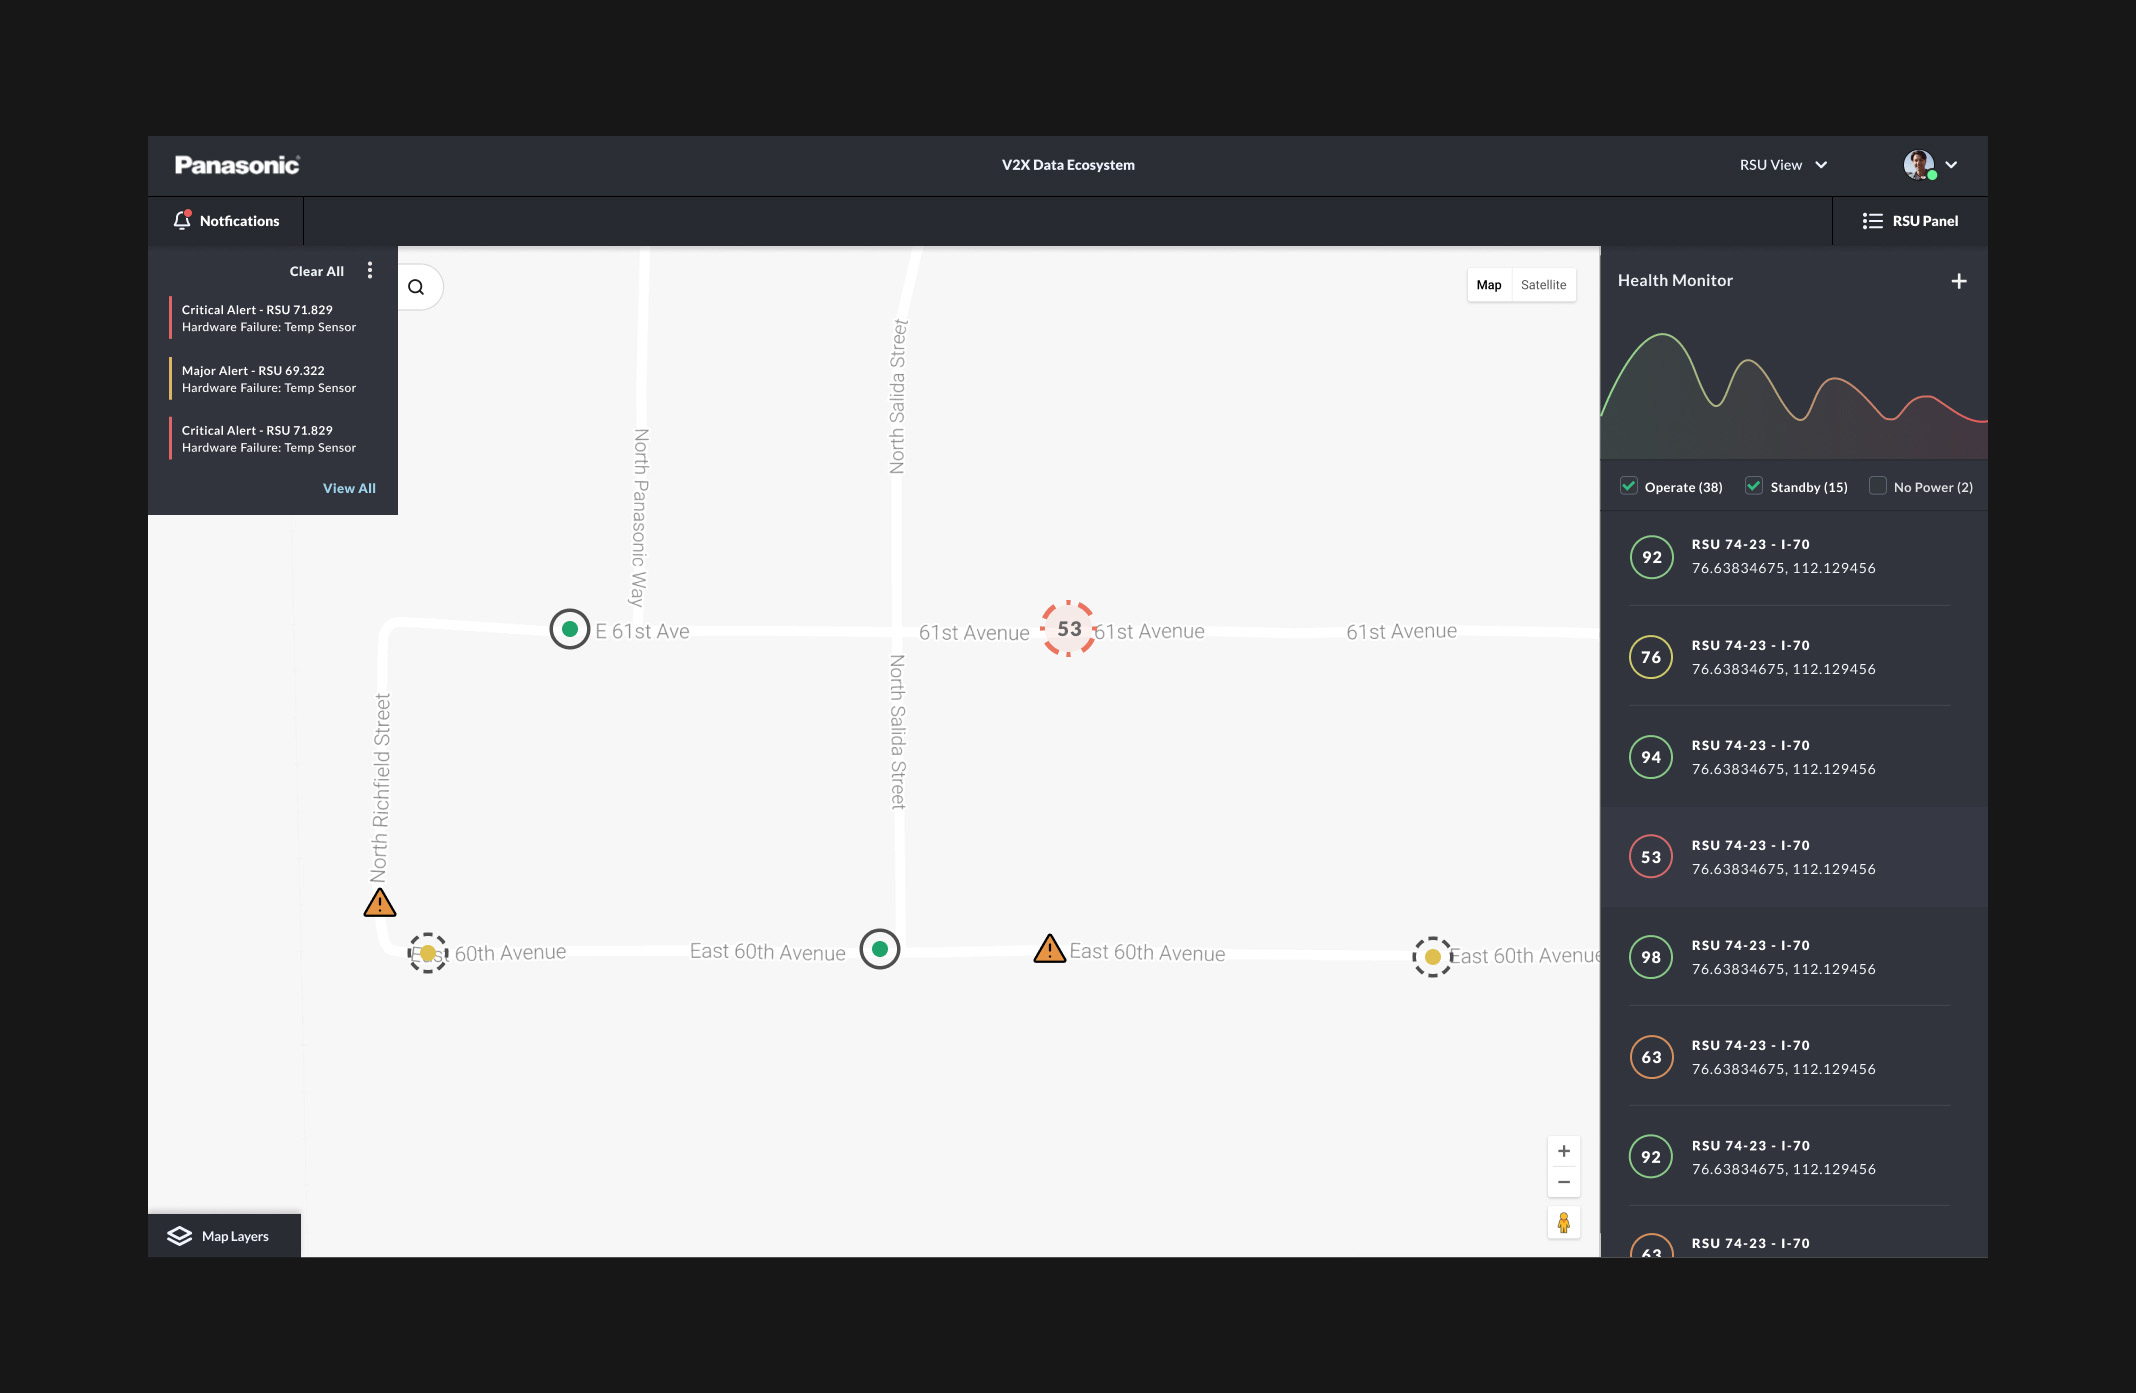
The chosen UI theme focused on clarity and usability, ensuring that traffic operators could quickly access and interpret the most critical information without being overwhelmed by the vast amounts of data the system could receive. The design was centered around providing actionable insights through a clean and intuitive interface surrounding an interactive map elements.
- Focusing on Value-Added Elements: The interface was designed to prioritize only the data and elements that added tangible value to traffic operators, filtering out unnecessary information to prevent overload.
- Map Layer Toggles and Event Tabs: These were made the primary tools for quickly identifying and assessing events as they occurred, helping operators gain contextual awareness of situations in real time.
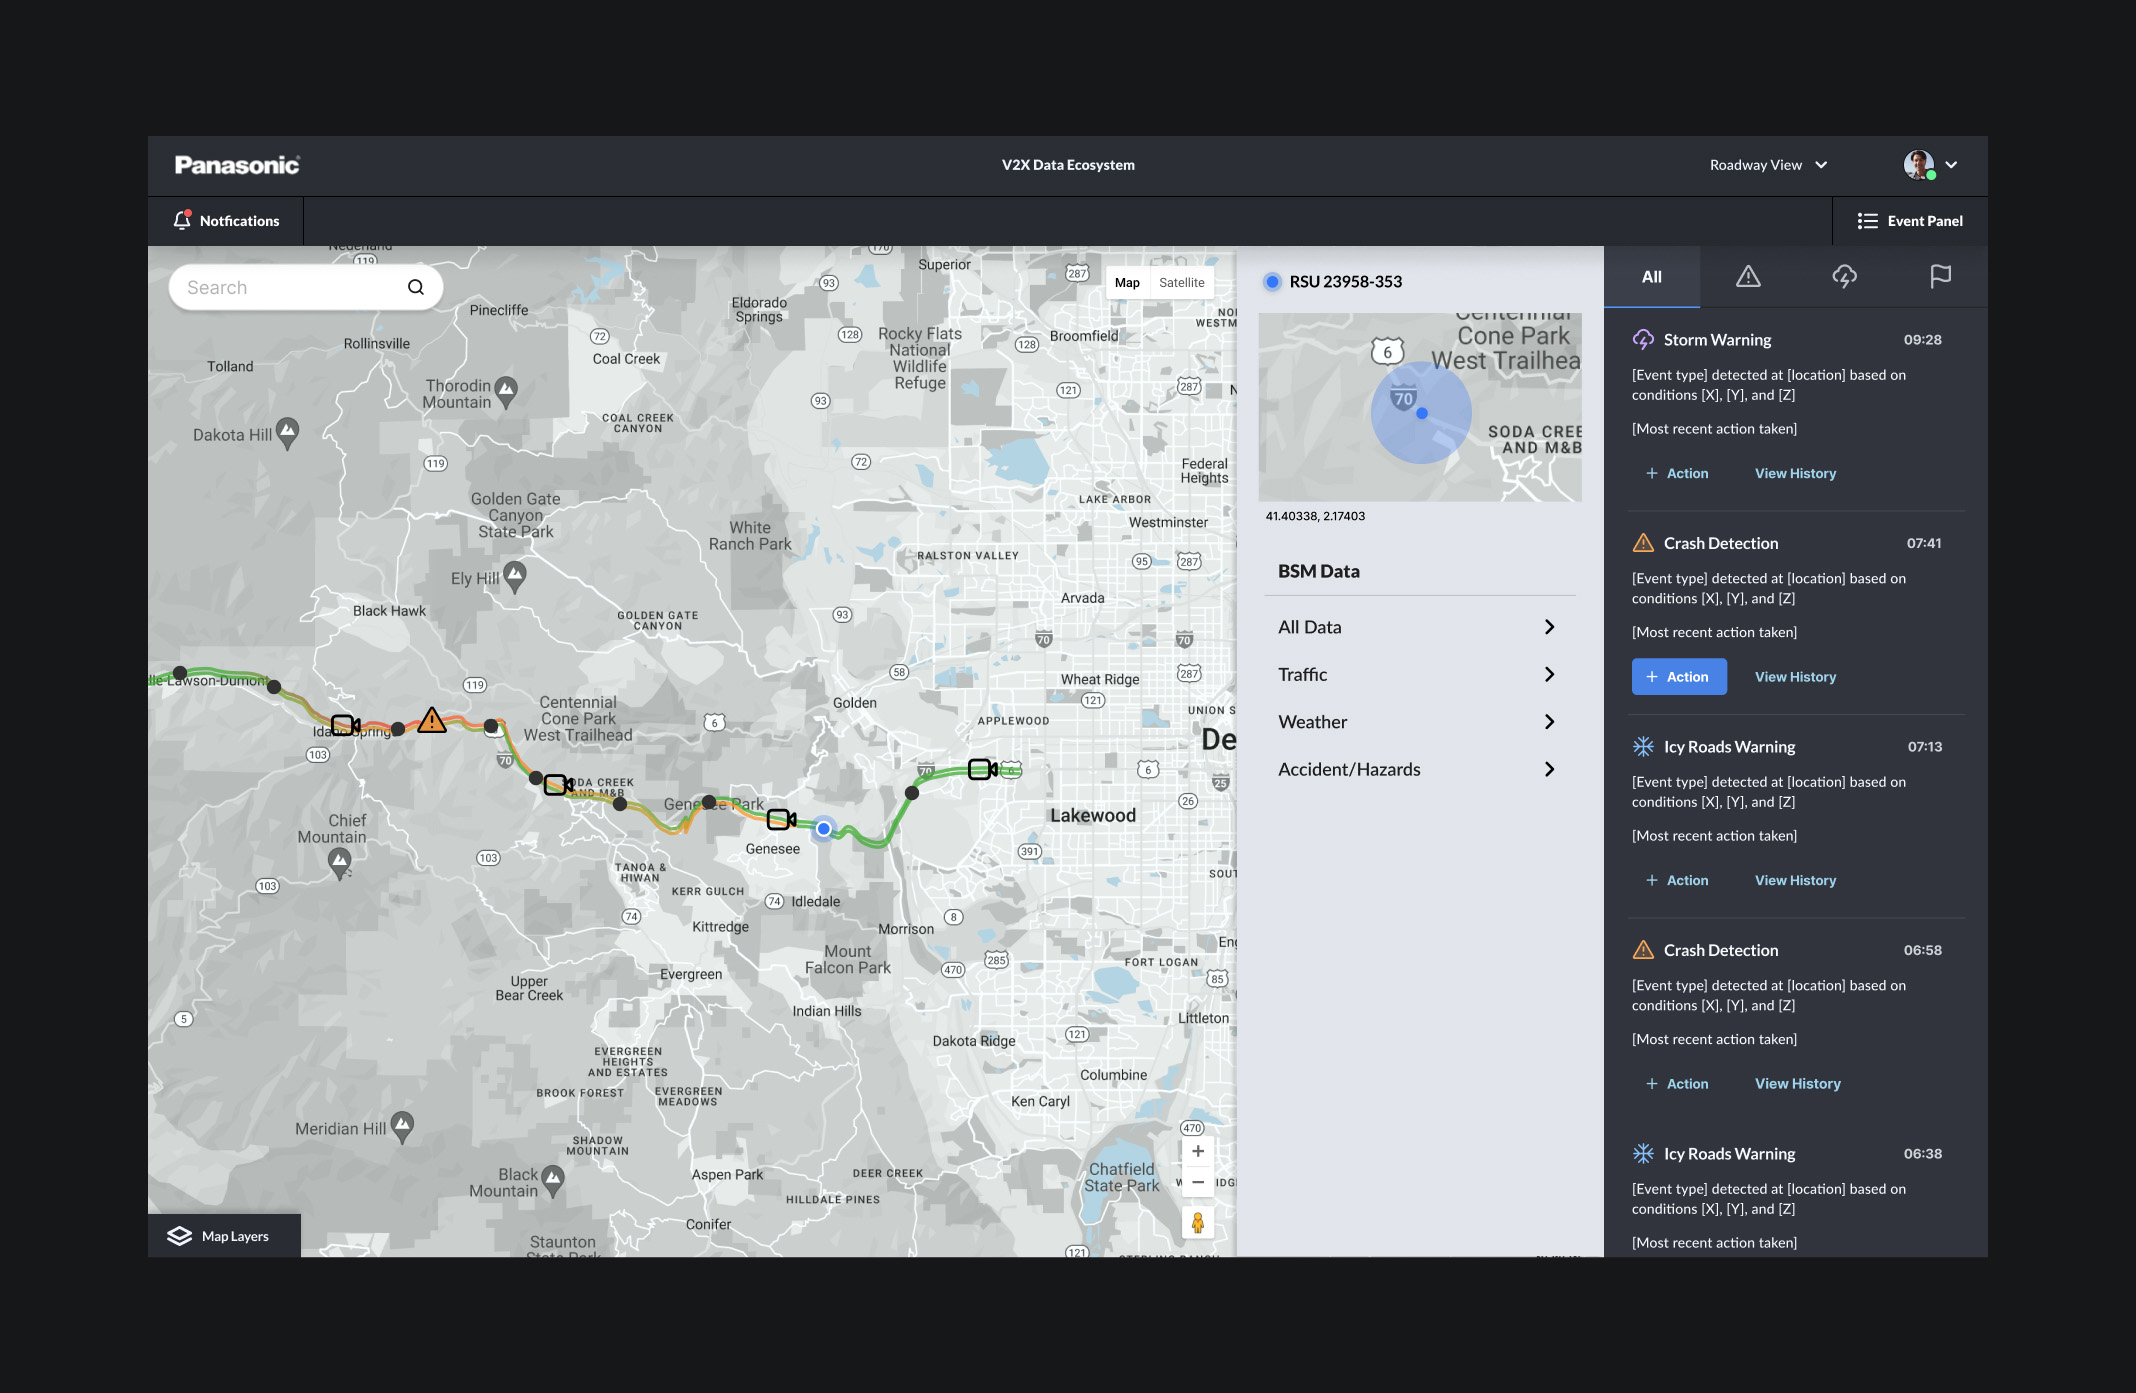
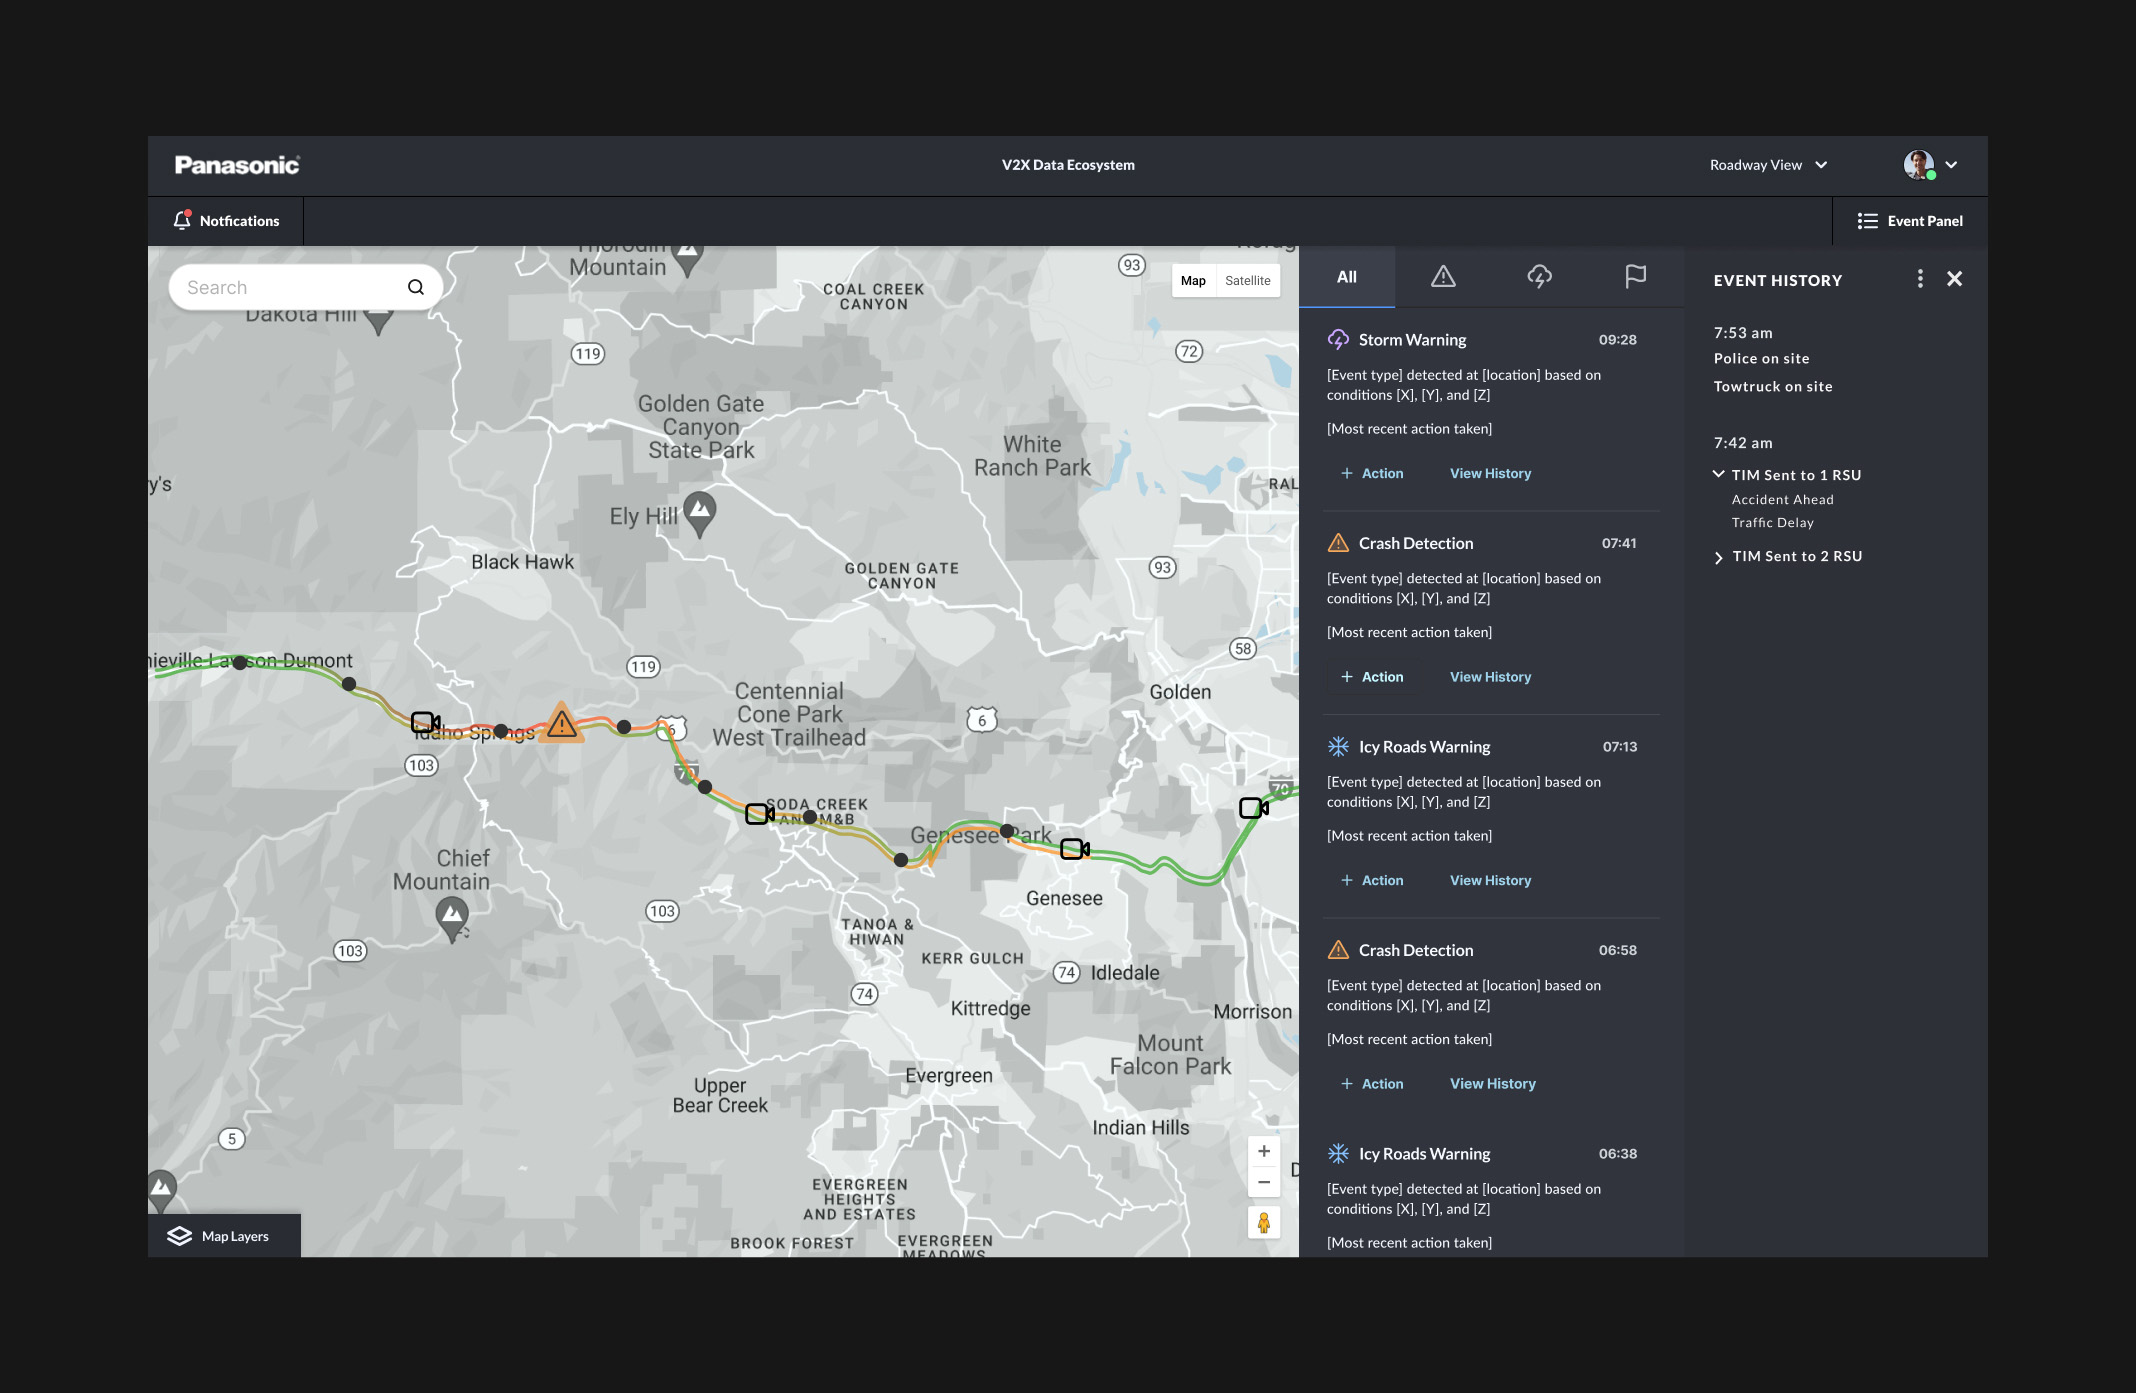
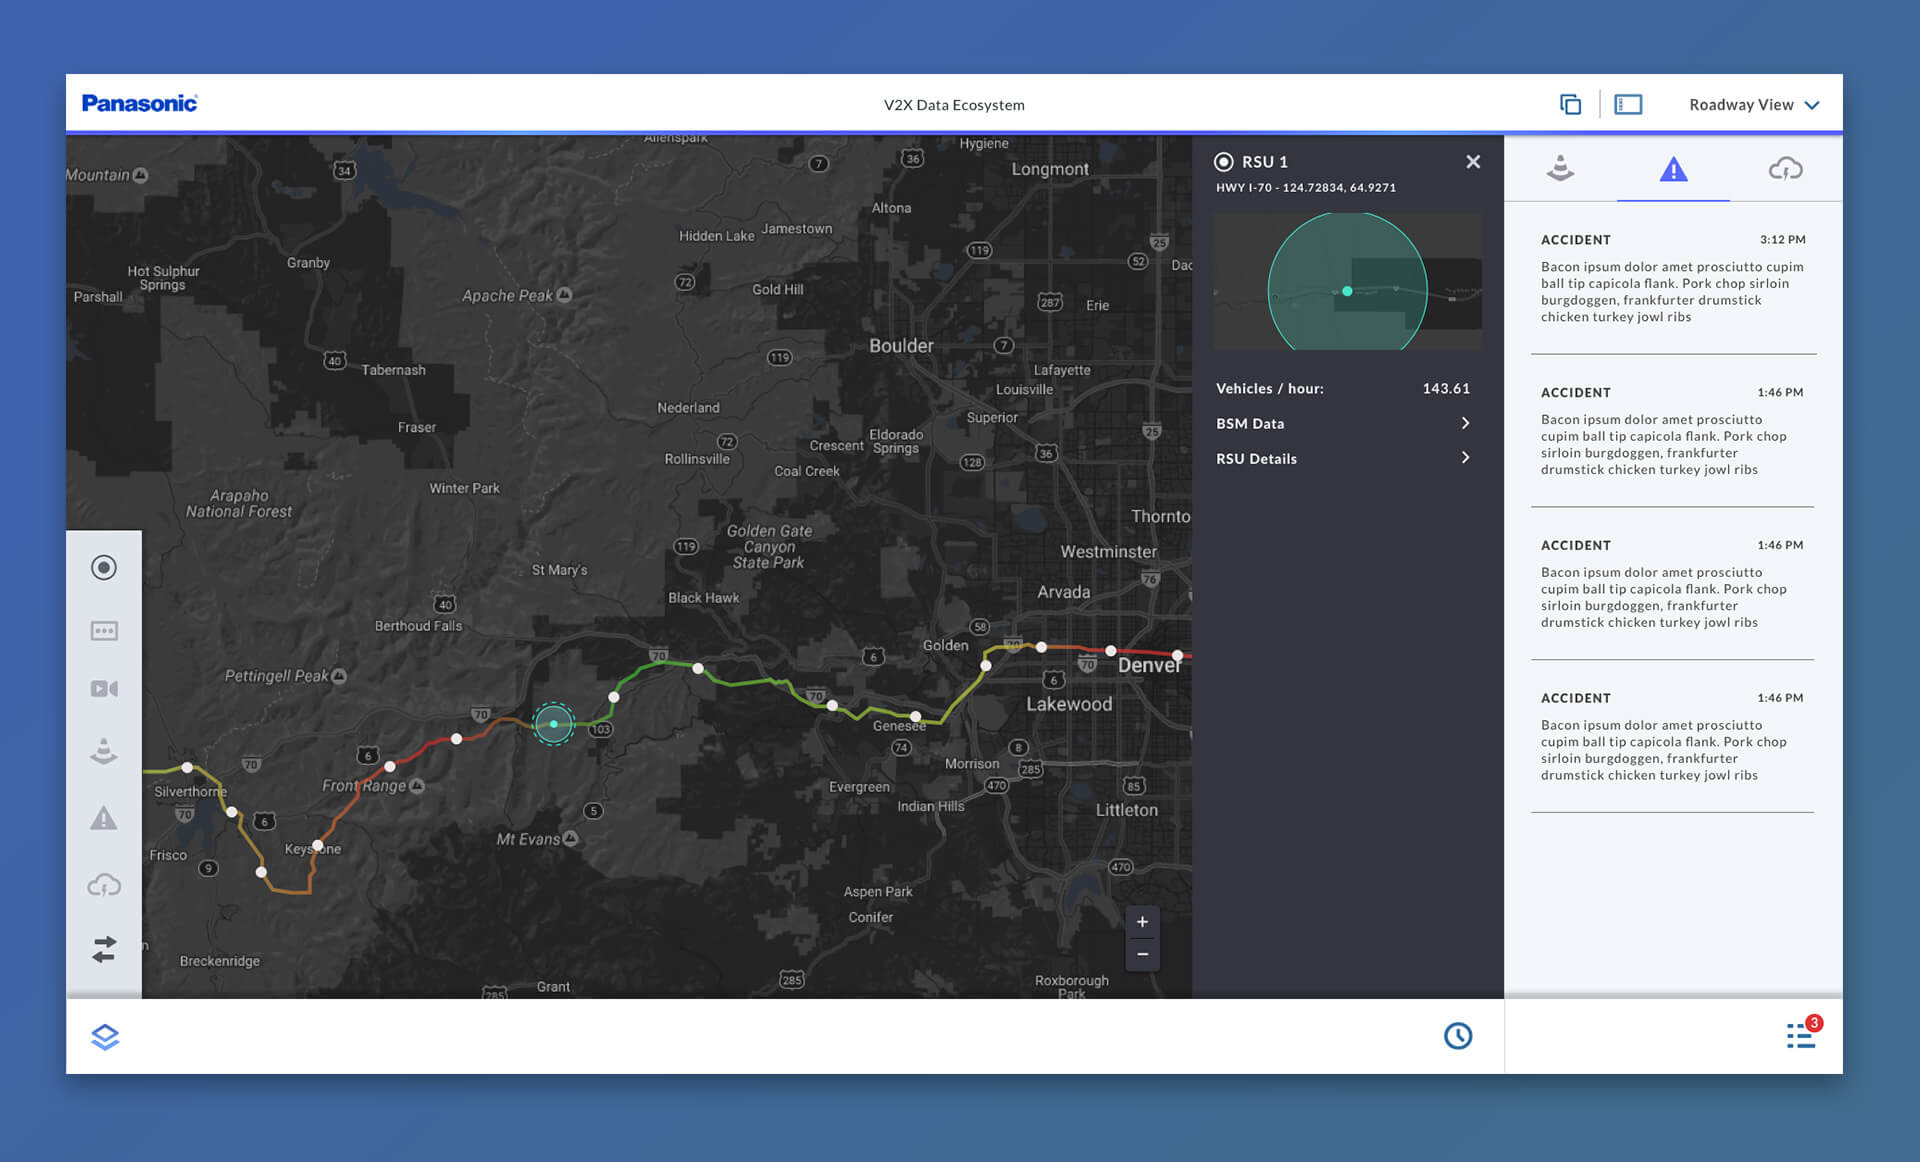
Iterating based on real-world testing and technical validation
As higher-fidelity iterations of the product began to emerge, we entered into several sprints of real-world testing. This involved driving V2X-enabled vehicles on a test track and working closely with engineers to monitor how the system handled data transmission and visualization.
- Component-Level Adjustments: Based on the testing results and engineer discussions, I made specific adjustments to components, ensuring accurate and timely data visualization.
- Adding Technical Context: I proactively worked to enhance the interface by incorporating more context and details that would be relevant to both operators and technical teams.
Enhancing visual context on RSU iconography
As the design evolved, we faced the challenge of effectively visualizing the health and performance of Roadside Units (RSUs). Early iterations of the RSU icons were basic and lacked context. Through iterative design, I introduced color changes and stroke arrays to convey more detailed status information, making the icons not only more informative but also accessible to users with color blindness and compliance with ADA guidelines.
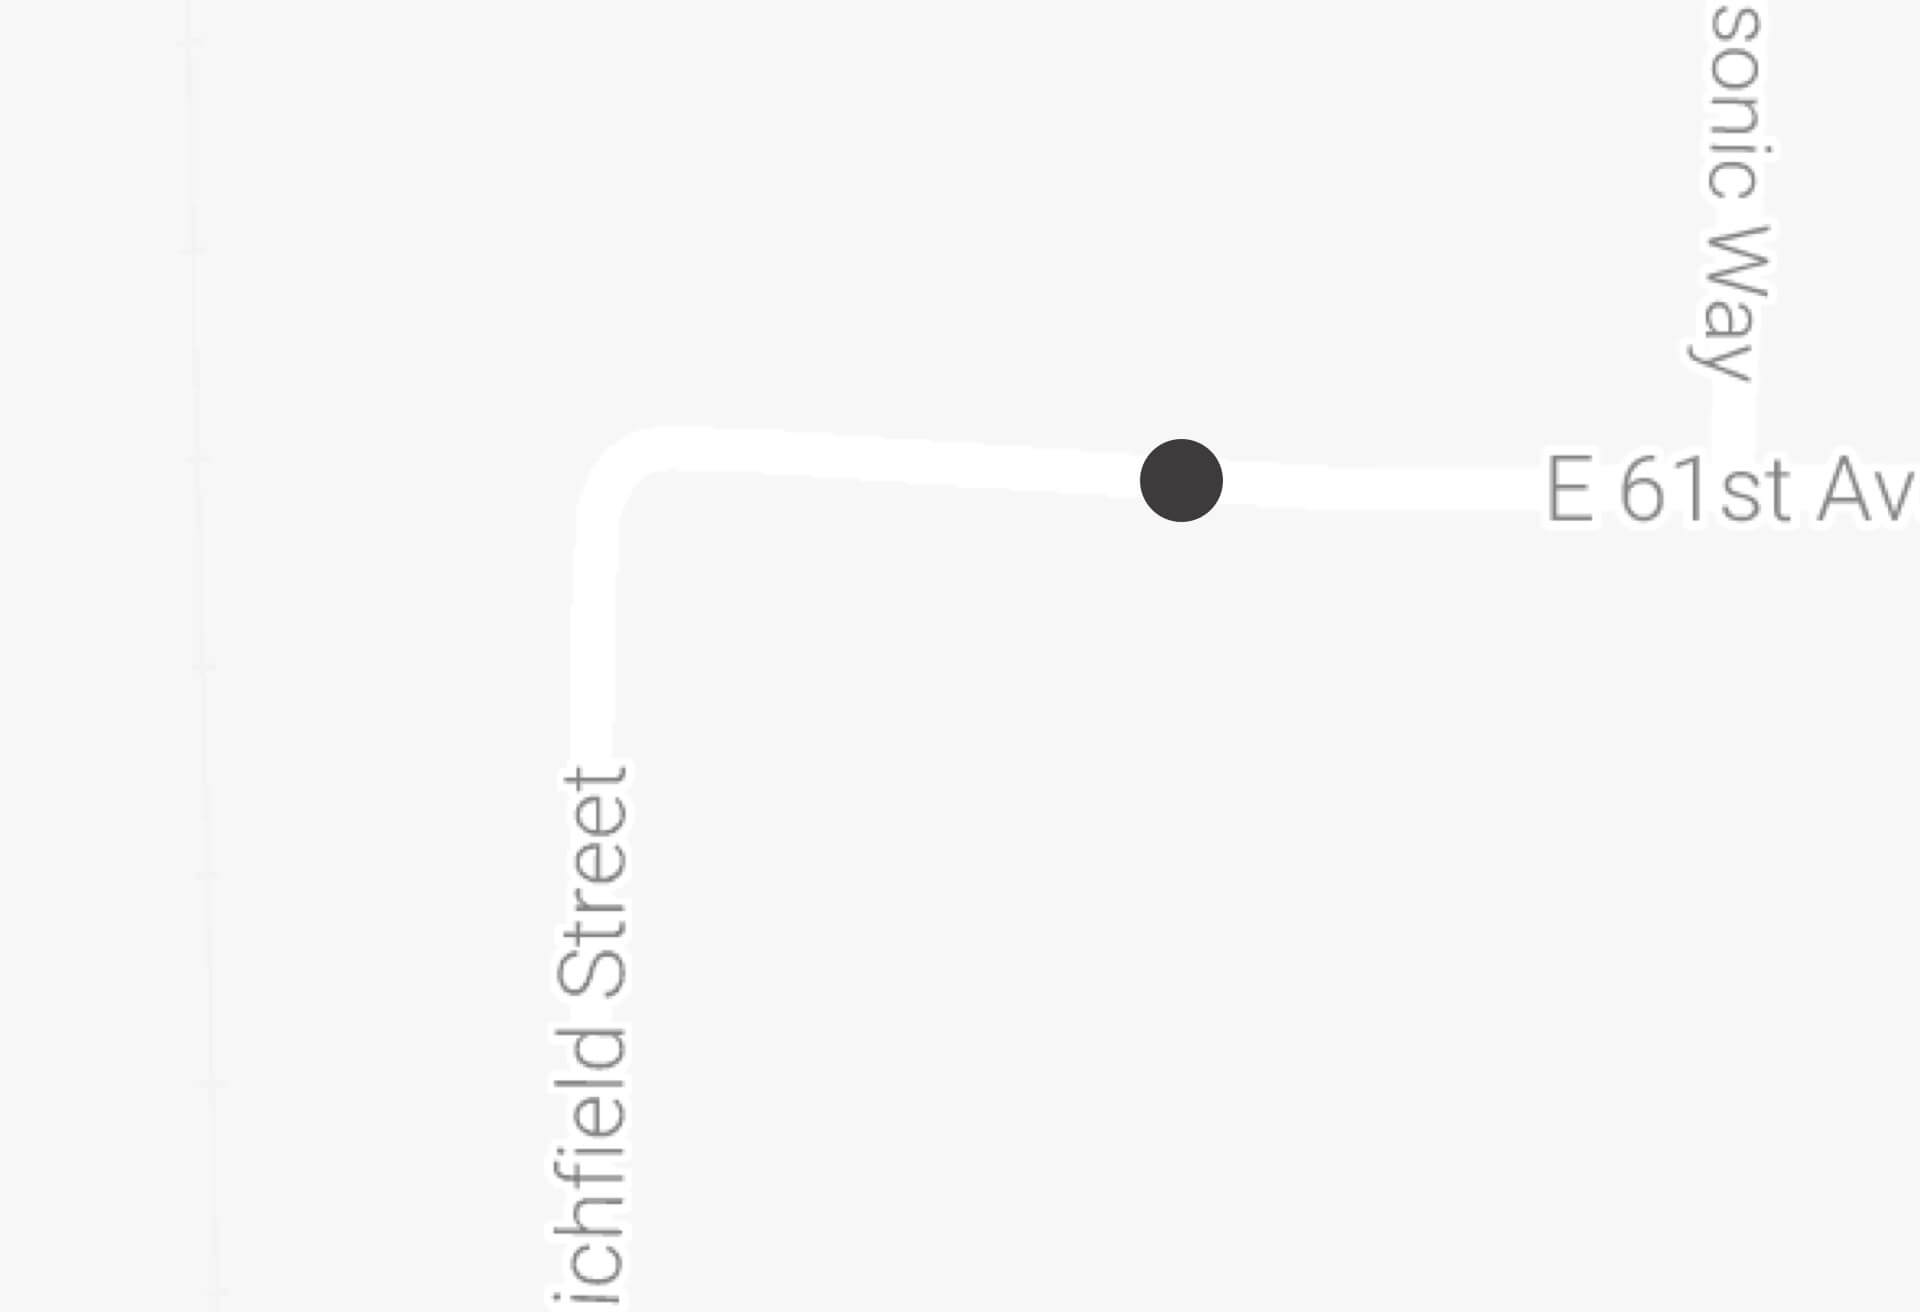 Plan ol' dots were the
starting point
Plan ol' dots were the
starting point
 This made demonstrations
simple to explain, but didn't scale well or provide real context.
This made demonstrations
simple to explain, but didn't scale well or provide real context.
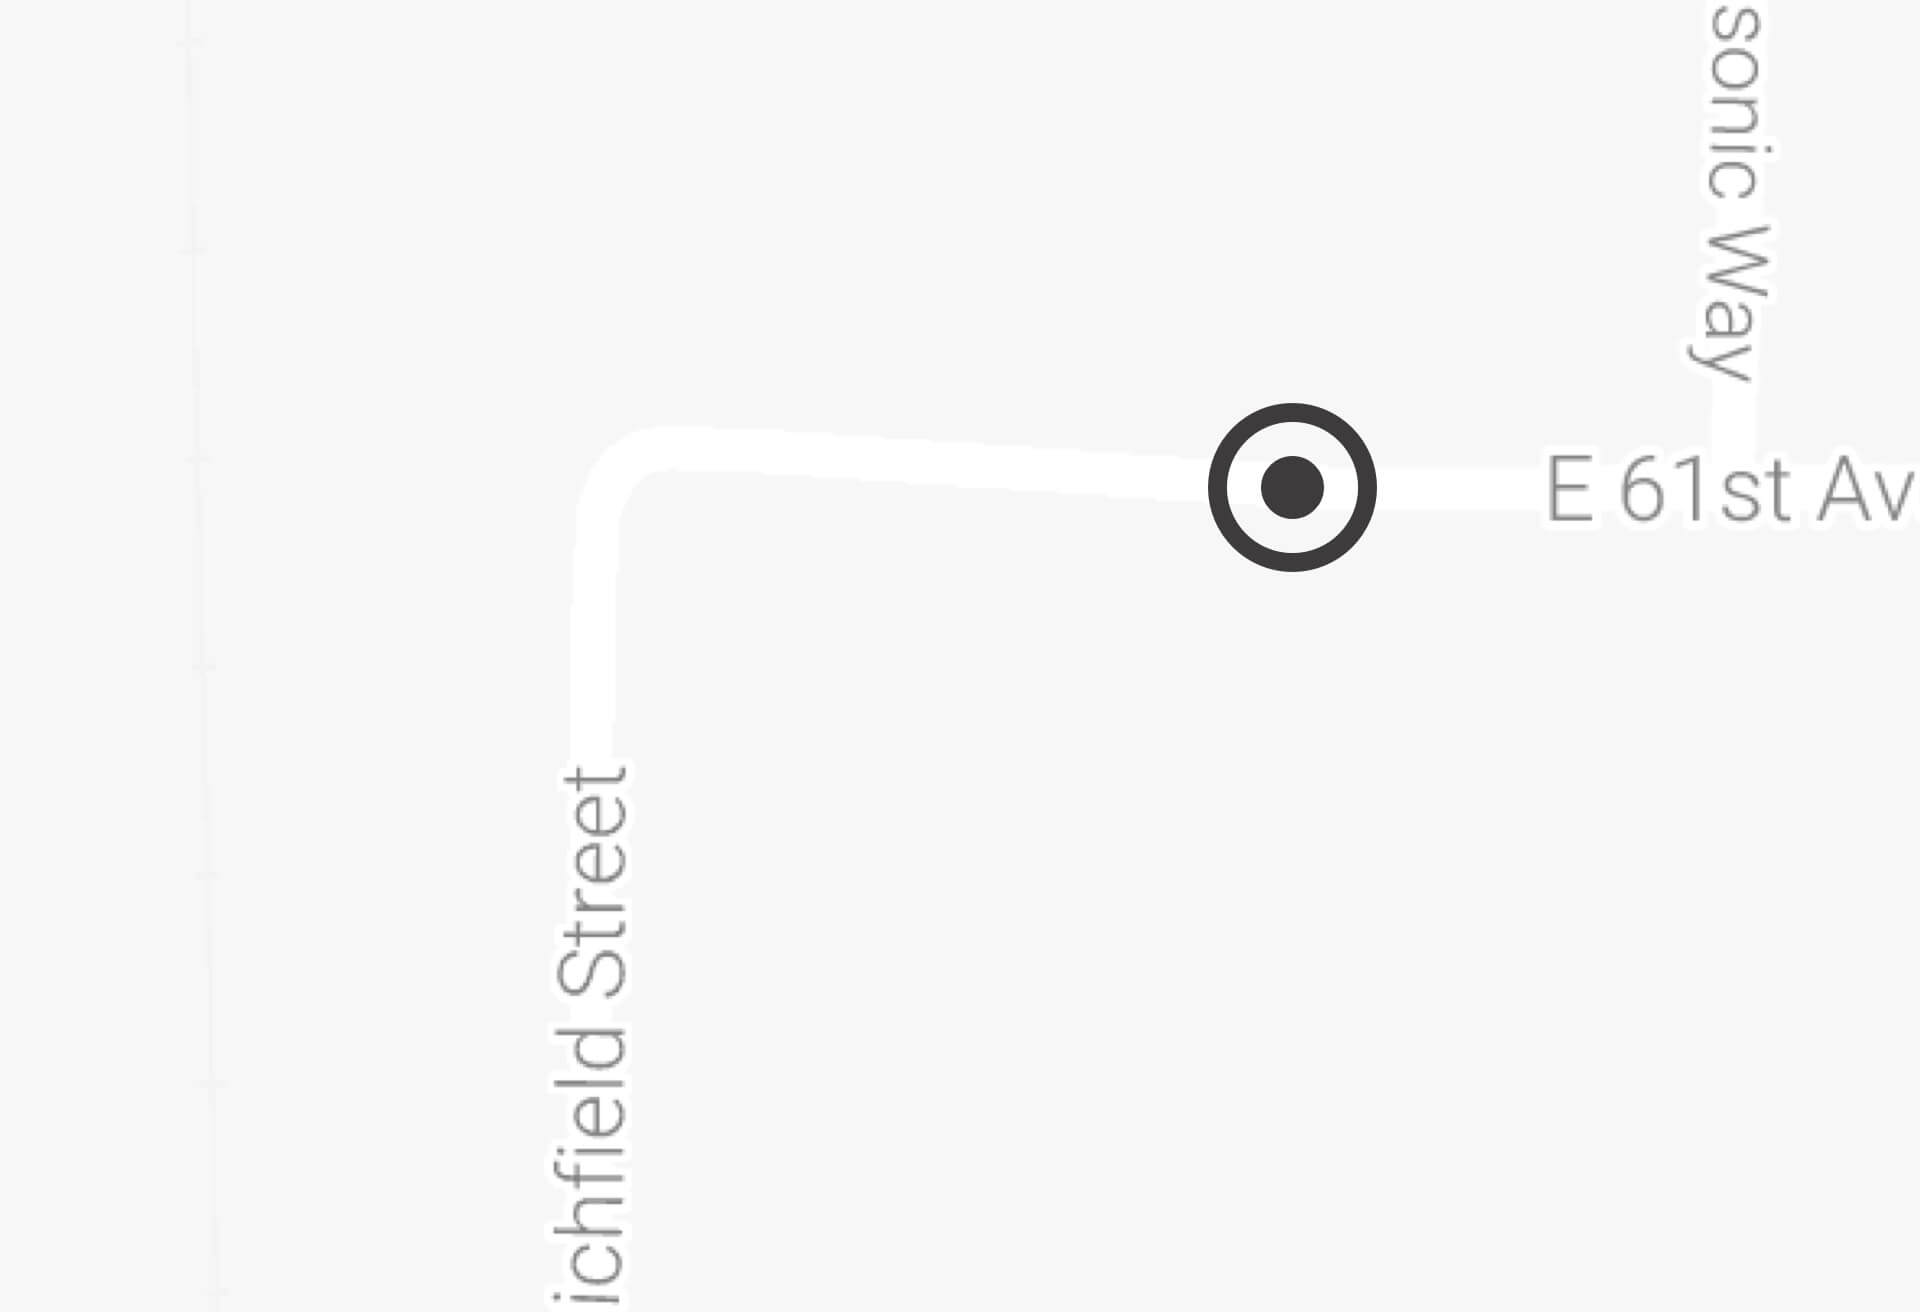 The filled circle, with
simple ring felt distinct enough with better scalability.
The filled circle, with
simple ring felt distinct enough with better scalability.
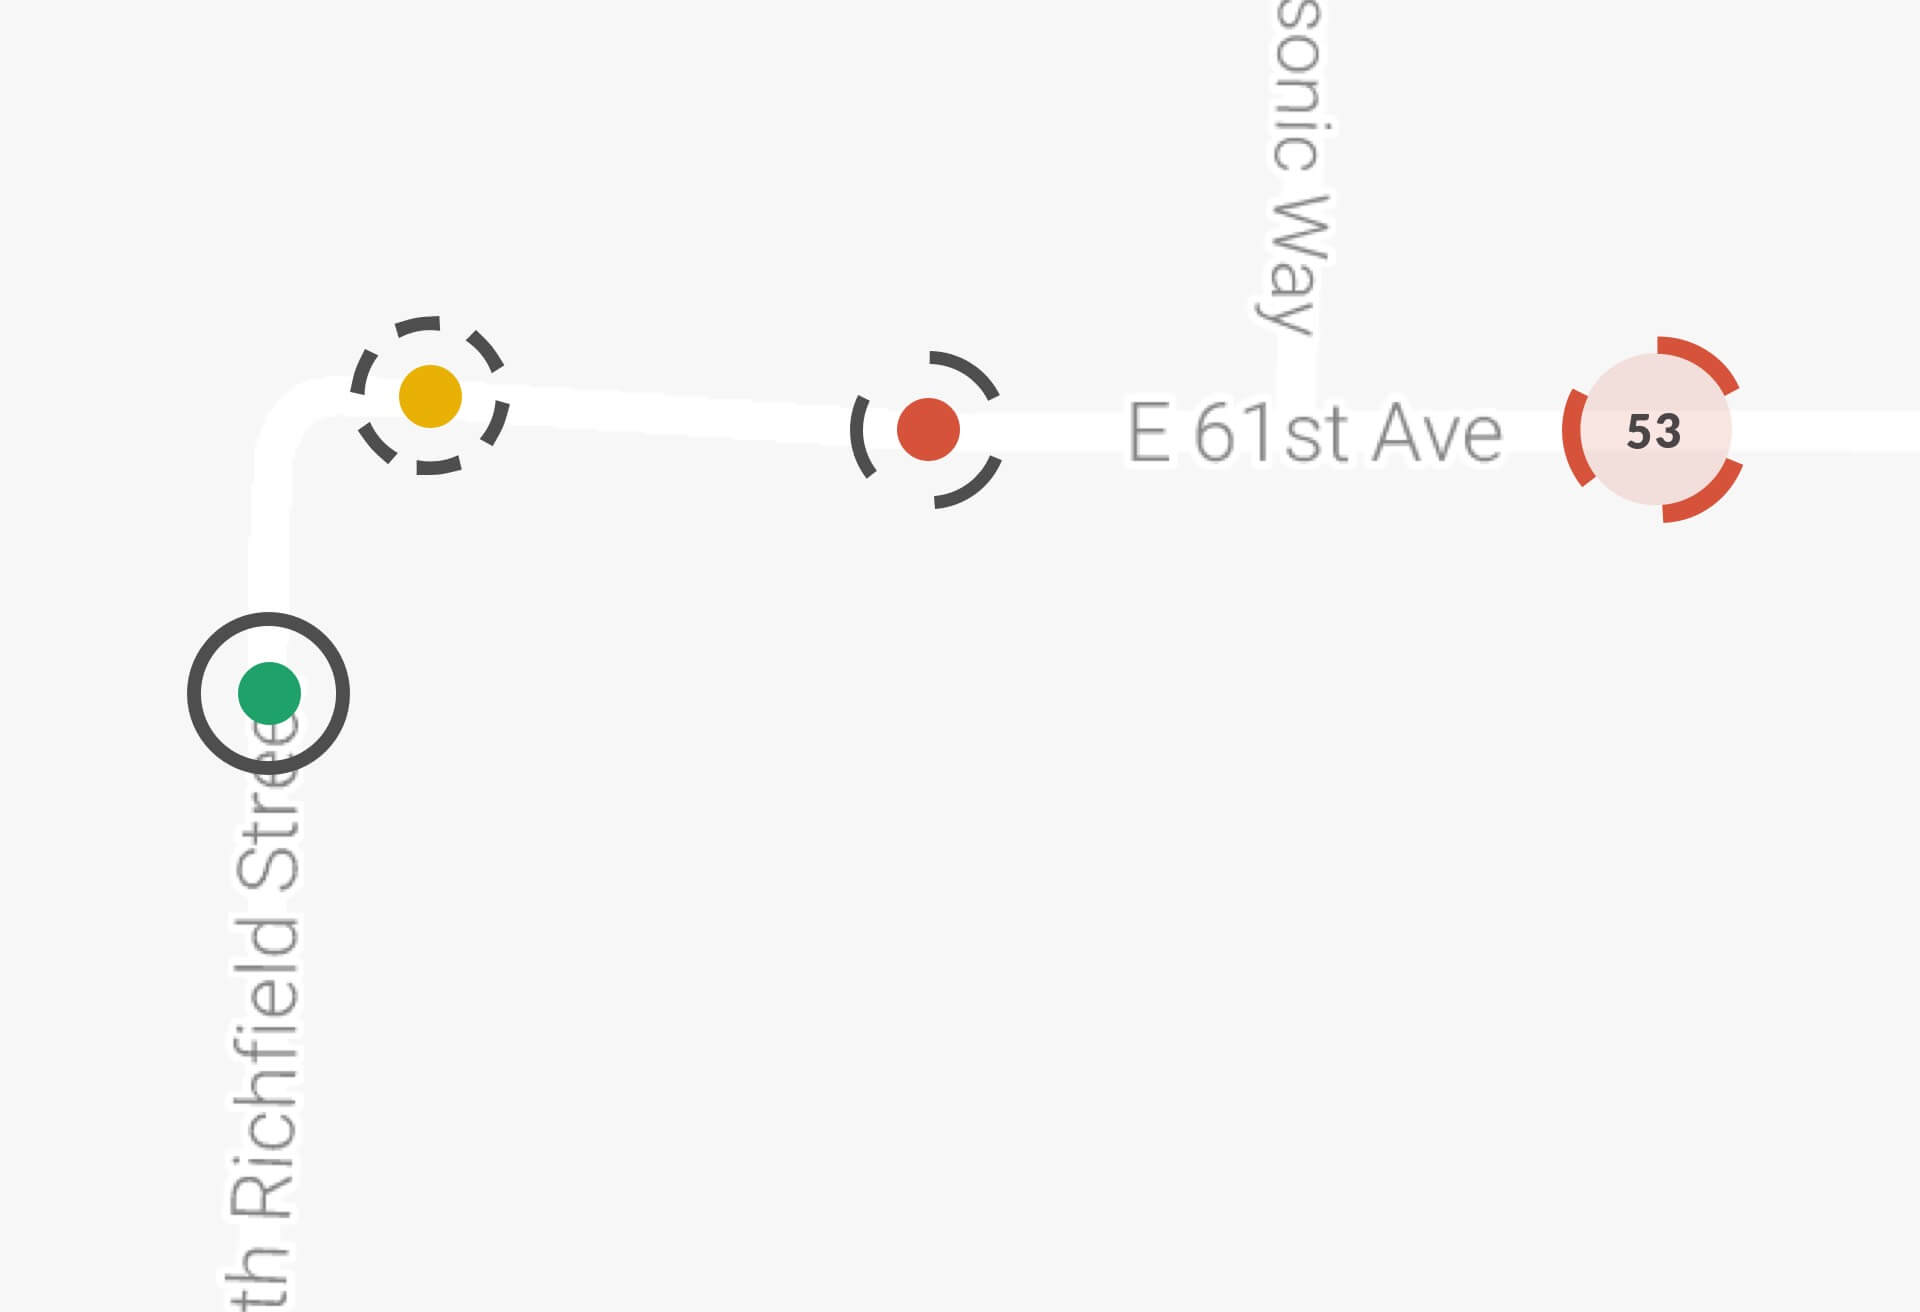 ADA compliant (color
blindness) and scalable with added context
ADA compliant (color
blindness) and scalable with added context
Diverging UI Paths: Tailoring for different audiences
As the UI continued to evolve, the focus on RSU iconography and other technical aspects began to signal a shift towards a more technically-focused module. This was the beginning of what would eventually become a separate product vertical, tailored to the needs of a more technically inclined user group.
- Expanding Technical Focus: The iterative adjustments to RSU visualizations not only enhanced the operator interface but also laid the groundwork for a specialized technical module. This module provided deeper insights into the performance and health of the RSUs, catering to the needs of engineers and other technical stakeholders.
 How might we quickly
communicate RSU 'health' for troubleshooting and performance?
How might we quickly
communicate RSU 'health' for troubleshooting and performance?
 If we have RSU health, we can
add health-specific hardware notifications.
If we have RSU health, we can
add health-specific hardware notifications.
VII.
Coming Full Circle: The impact on traffic operators and public roadways
The project aimed to equip traffic operators with simple, intuitive, and actionable insights to reduce response times to roadway events. As the design evolved, it became clear that the solution was set to address this goal effectively.
- Empowering Traffic Operators: The streamlined UI provided operators with clear, real-time, advanced insights into roadway conditions, enabling quicker and more informed decision-making.
- Enhancing Public Safety: By reducing response times, the system had the potential to improve safety and decrease congestion, making V2X-enabled roadways safer and more efficient.
With the foundation in place, the next step was to demonstrate the product's value through live demonstrations, a critical moment in securing our first major client.
VIII.
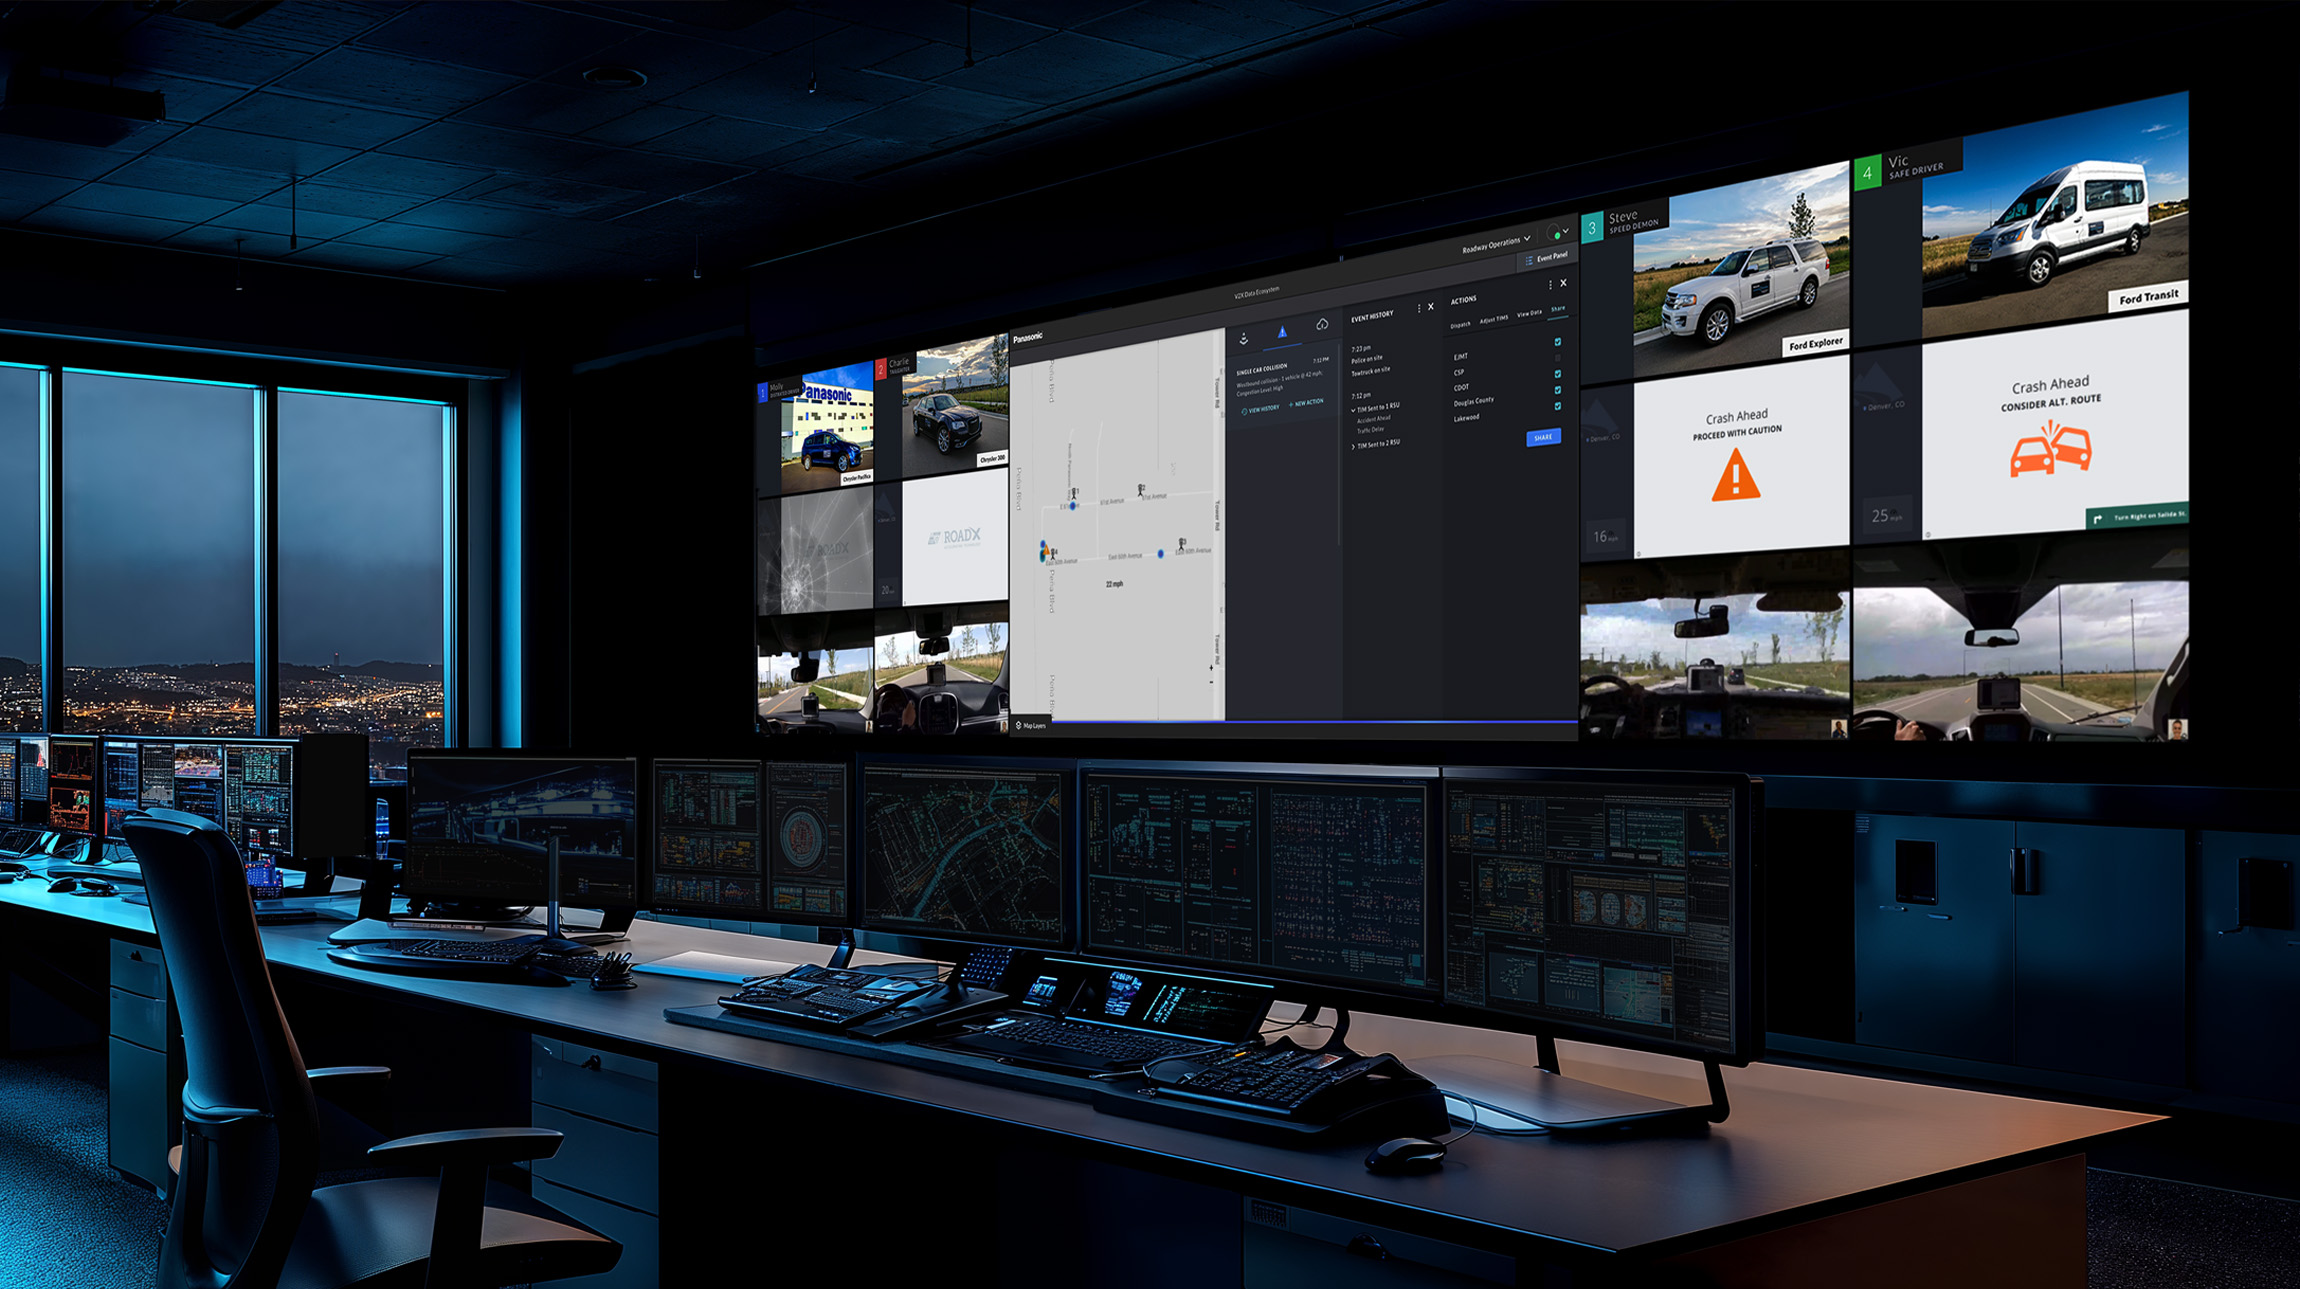
From Design to Demonstration: Securing our first major customer
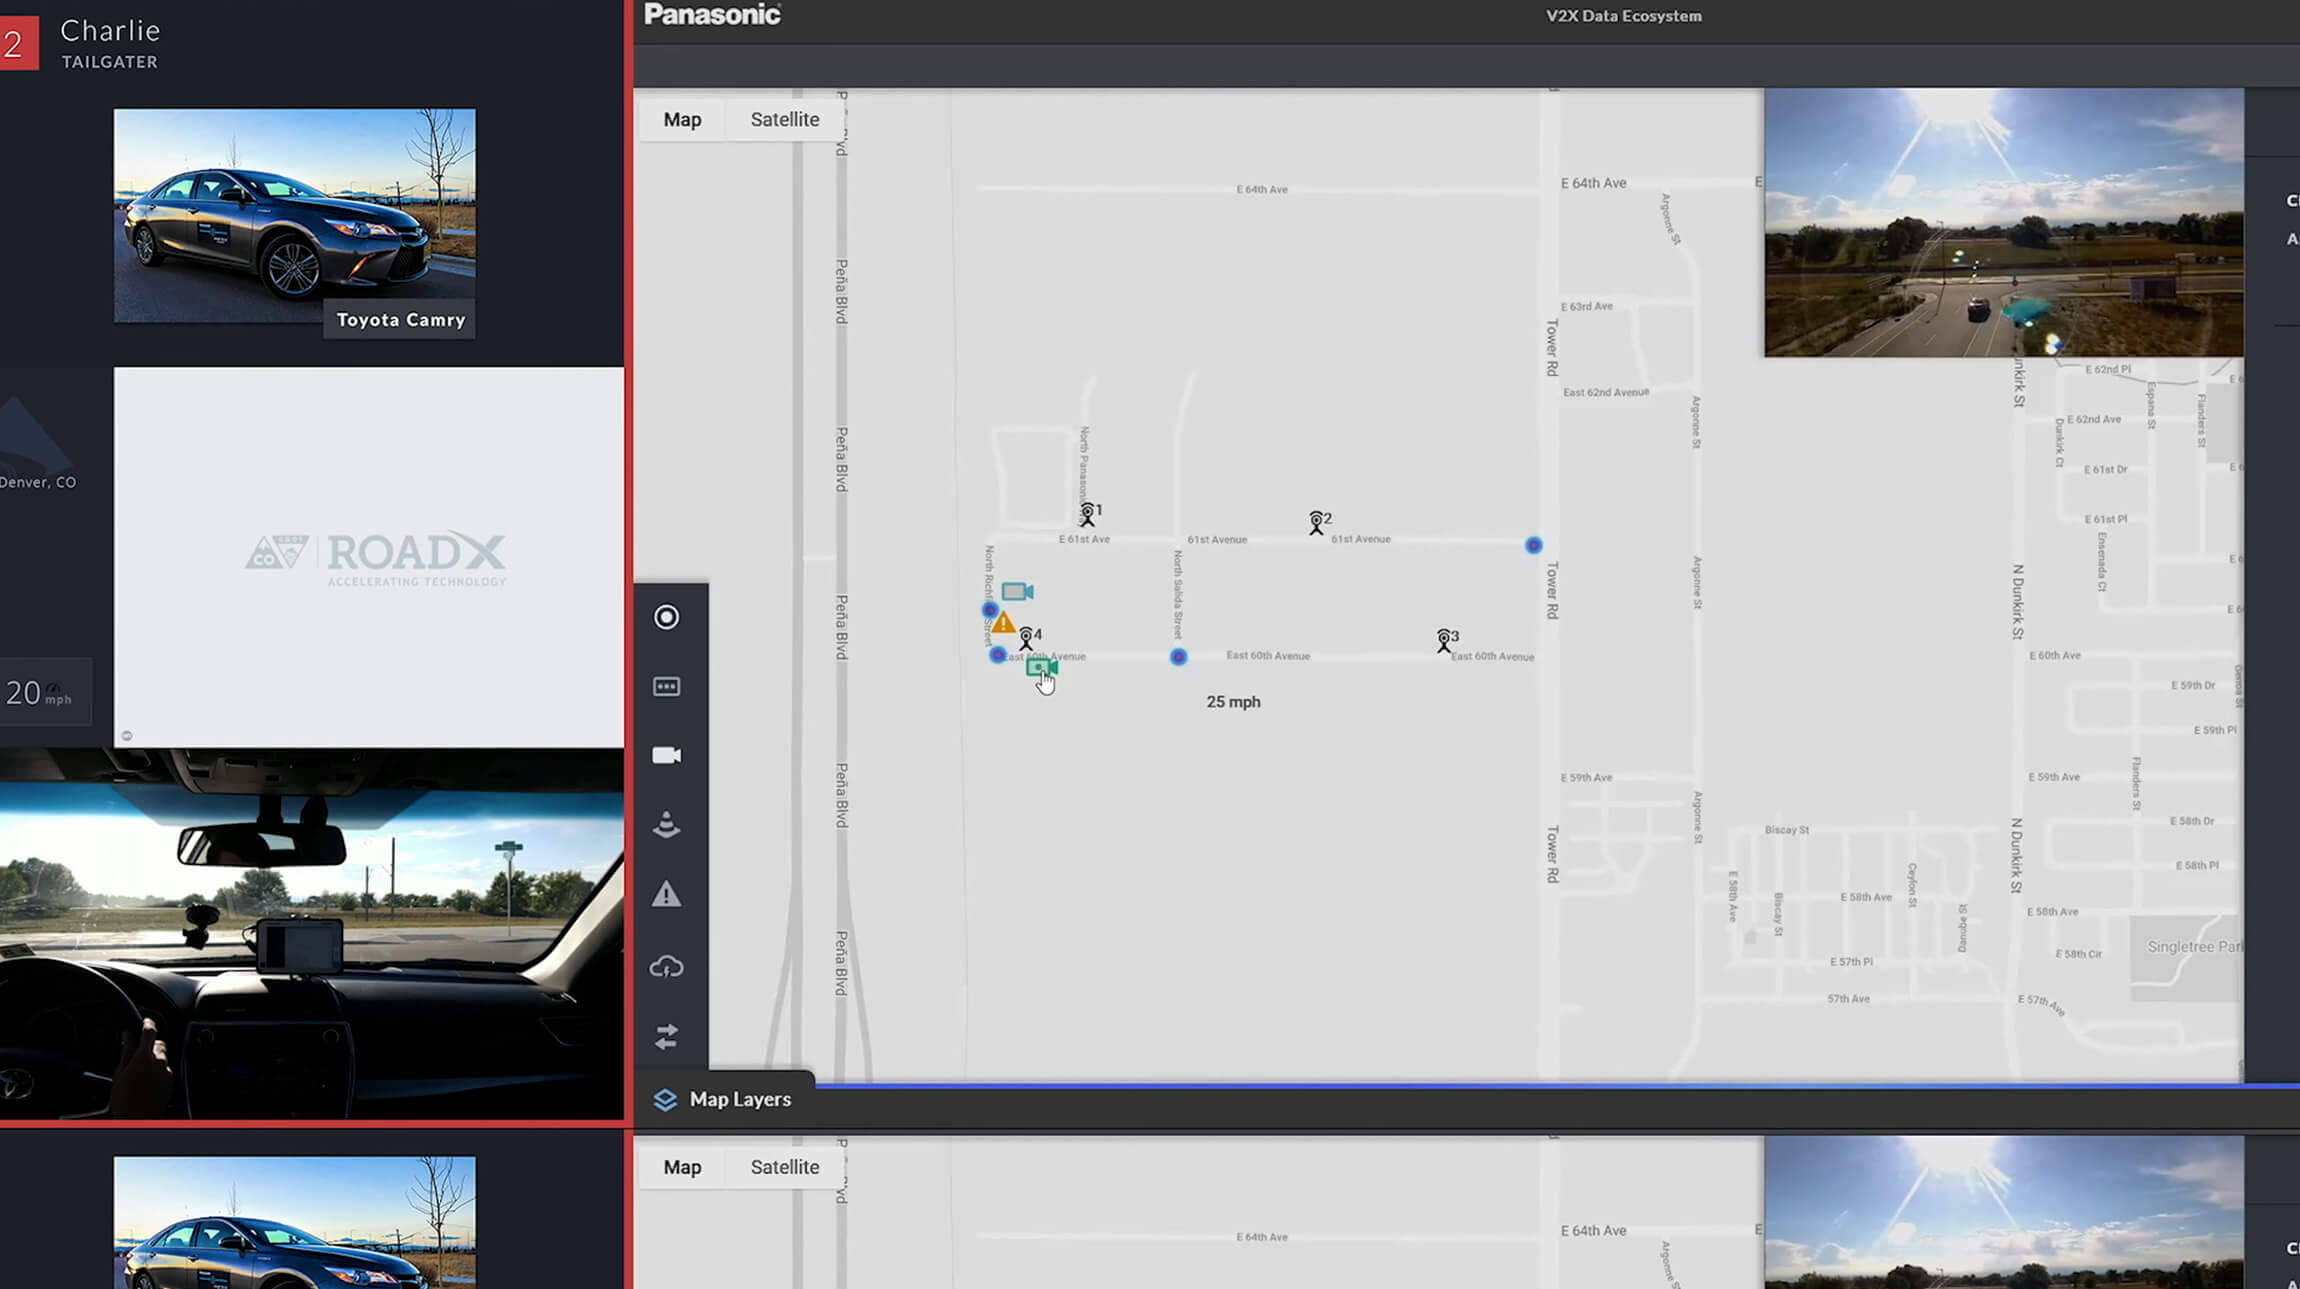
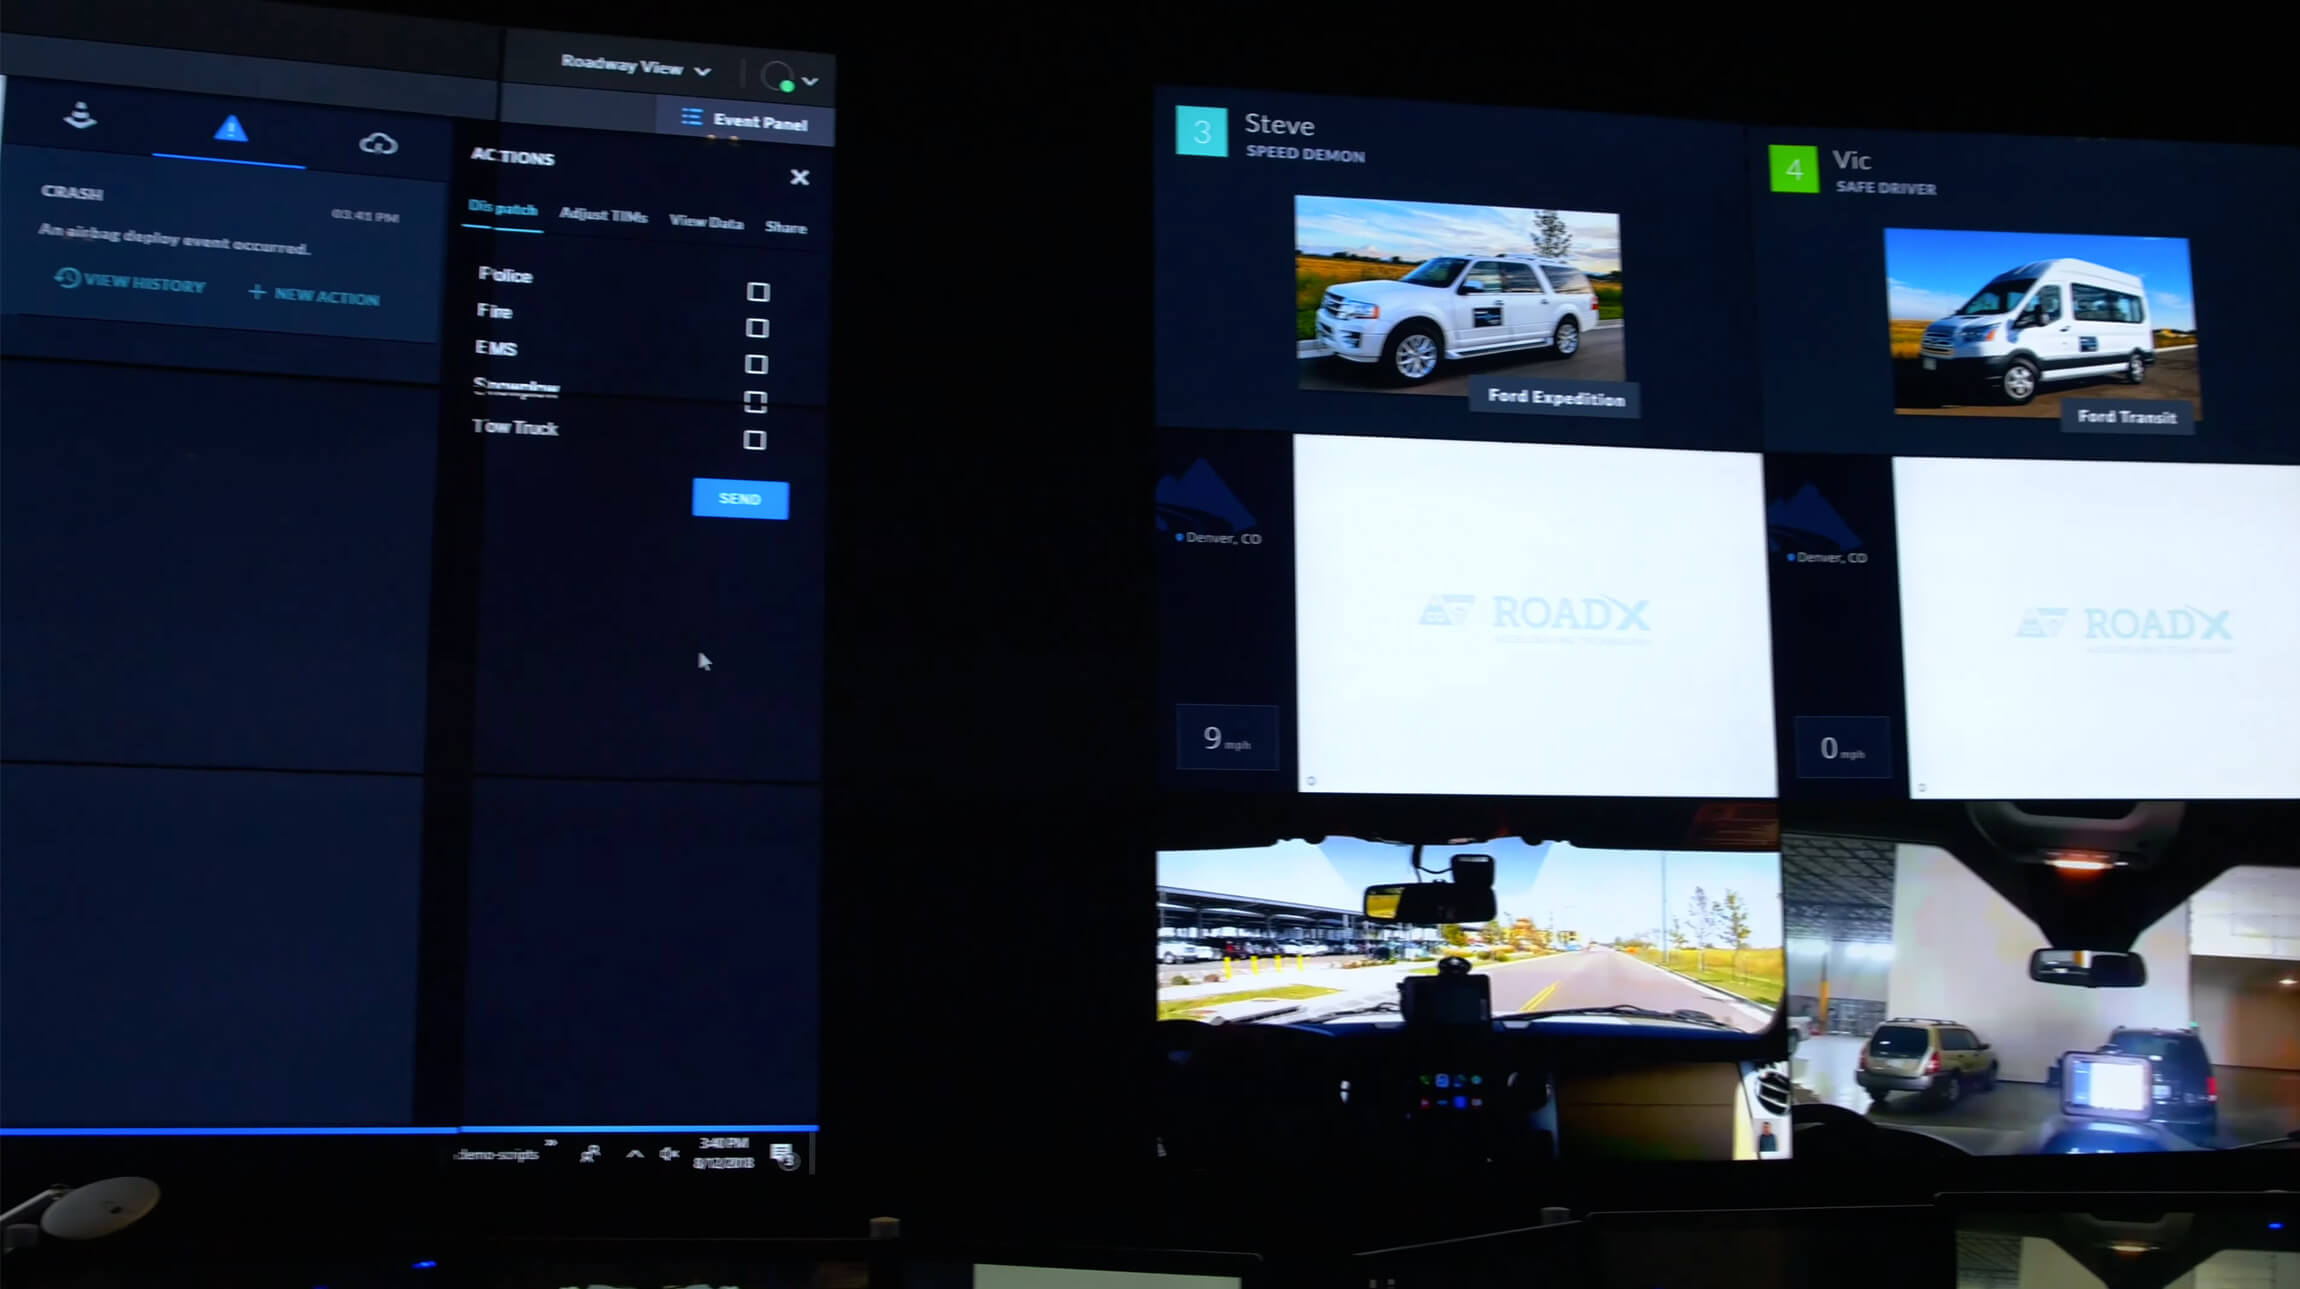
With all of these components, we were able to holistically illustrate our product vision in an emerging connected vehicle market space. We conducted product demonstrations at an onsite Network Operations Center with four V2X-equipped vehicles, each with a unique driver persona.
Through various stages of the demonstration, we showcased distinct V2X use cases, revealing how our product provided unparalleled real-time roadway insights. These dynamic demonstrations effectively communicated our vision to major OEMs, state departments of transportation, and potential collaborators.

IV.
Pioneering Success: Launching the first statewide intelligent transportation program
The successful launch of Cirrus by Panasonic was grounded in our ability to demonstrate a working product that introduced new value in the connected vehicle space, coupled with a clear vision for reducing congestion and improving safety.
Seven months into my journey with the team, we broke new ground in October 2017. Following an initial pilot program, Panasonic secured a partnership with the Colorado Department of Transportation (CDOT) for the nation's first statewide intelligent transportation program. Together with CDOT and other strategic partners, our shared mission was to alleviate traffic congestion and enhance roadway safety, particularly along I-70, one of the most challenging corridors in the nation.
The initial design groundwork served as a strong foundation, contributing significantly to the team's launch success. However, this was just the beginning of our product design journey, with much more to be realized.
Next Steps
- Create a user research function for foundational insights and understanding.
- Develop a more formalized iterative process that works in a B2G partnership model.
- Work to standardize design principles and components with a Design System.
XI.
Retrospective
Looking back on this stage of the project I learned many things.
This was truly one of the most exciting teams and projects I have been a part of. It was a pleasure to get to work with so many intelligent, hardworking, fun team members who all had the same passion to do whatever it takes to figure out how to make a collective vision a reality.
In a product space as brand new as this was, it was a formidable challenge and true adventure - one with everyone putting on many hats. There was a lot of trial-by-fire in figuring what worked and what didn't, but the team spirit and camaraderie made an impressive milestone possible.